
Farm sector production expenses forecast to remain above 20-year average through 2025
- by Carrie Litkowski
- 5/13/2025
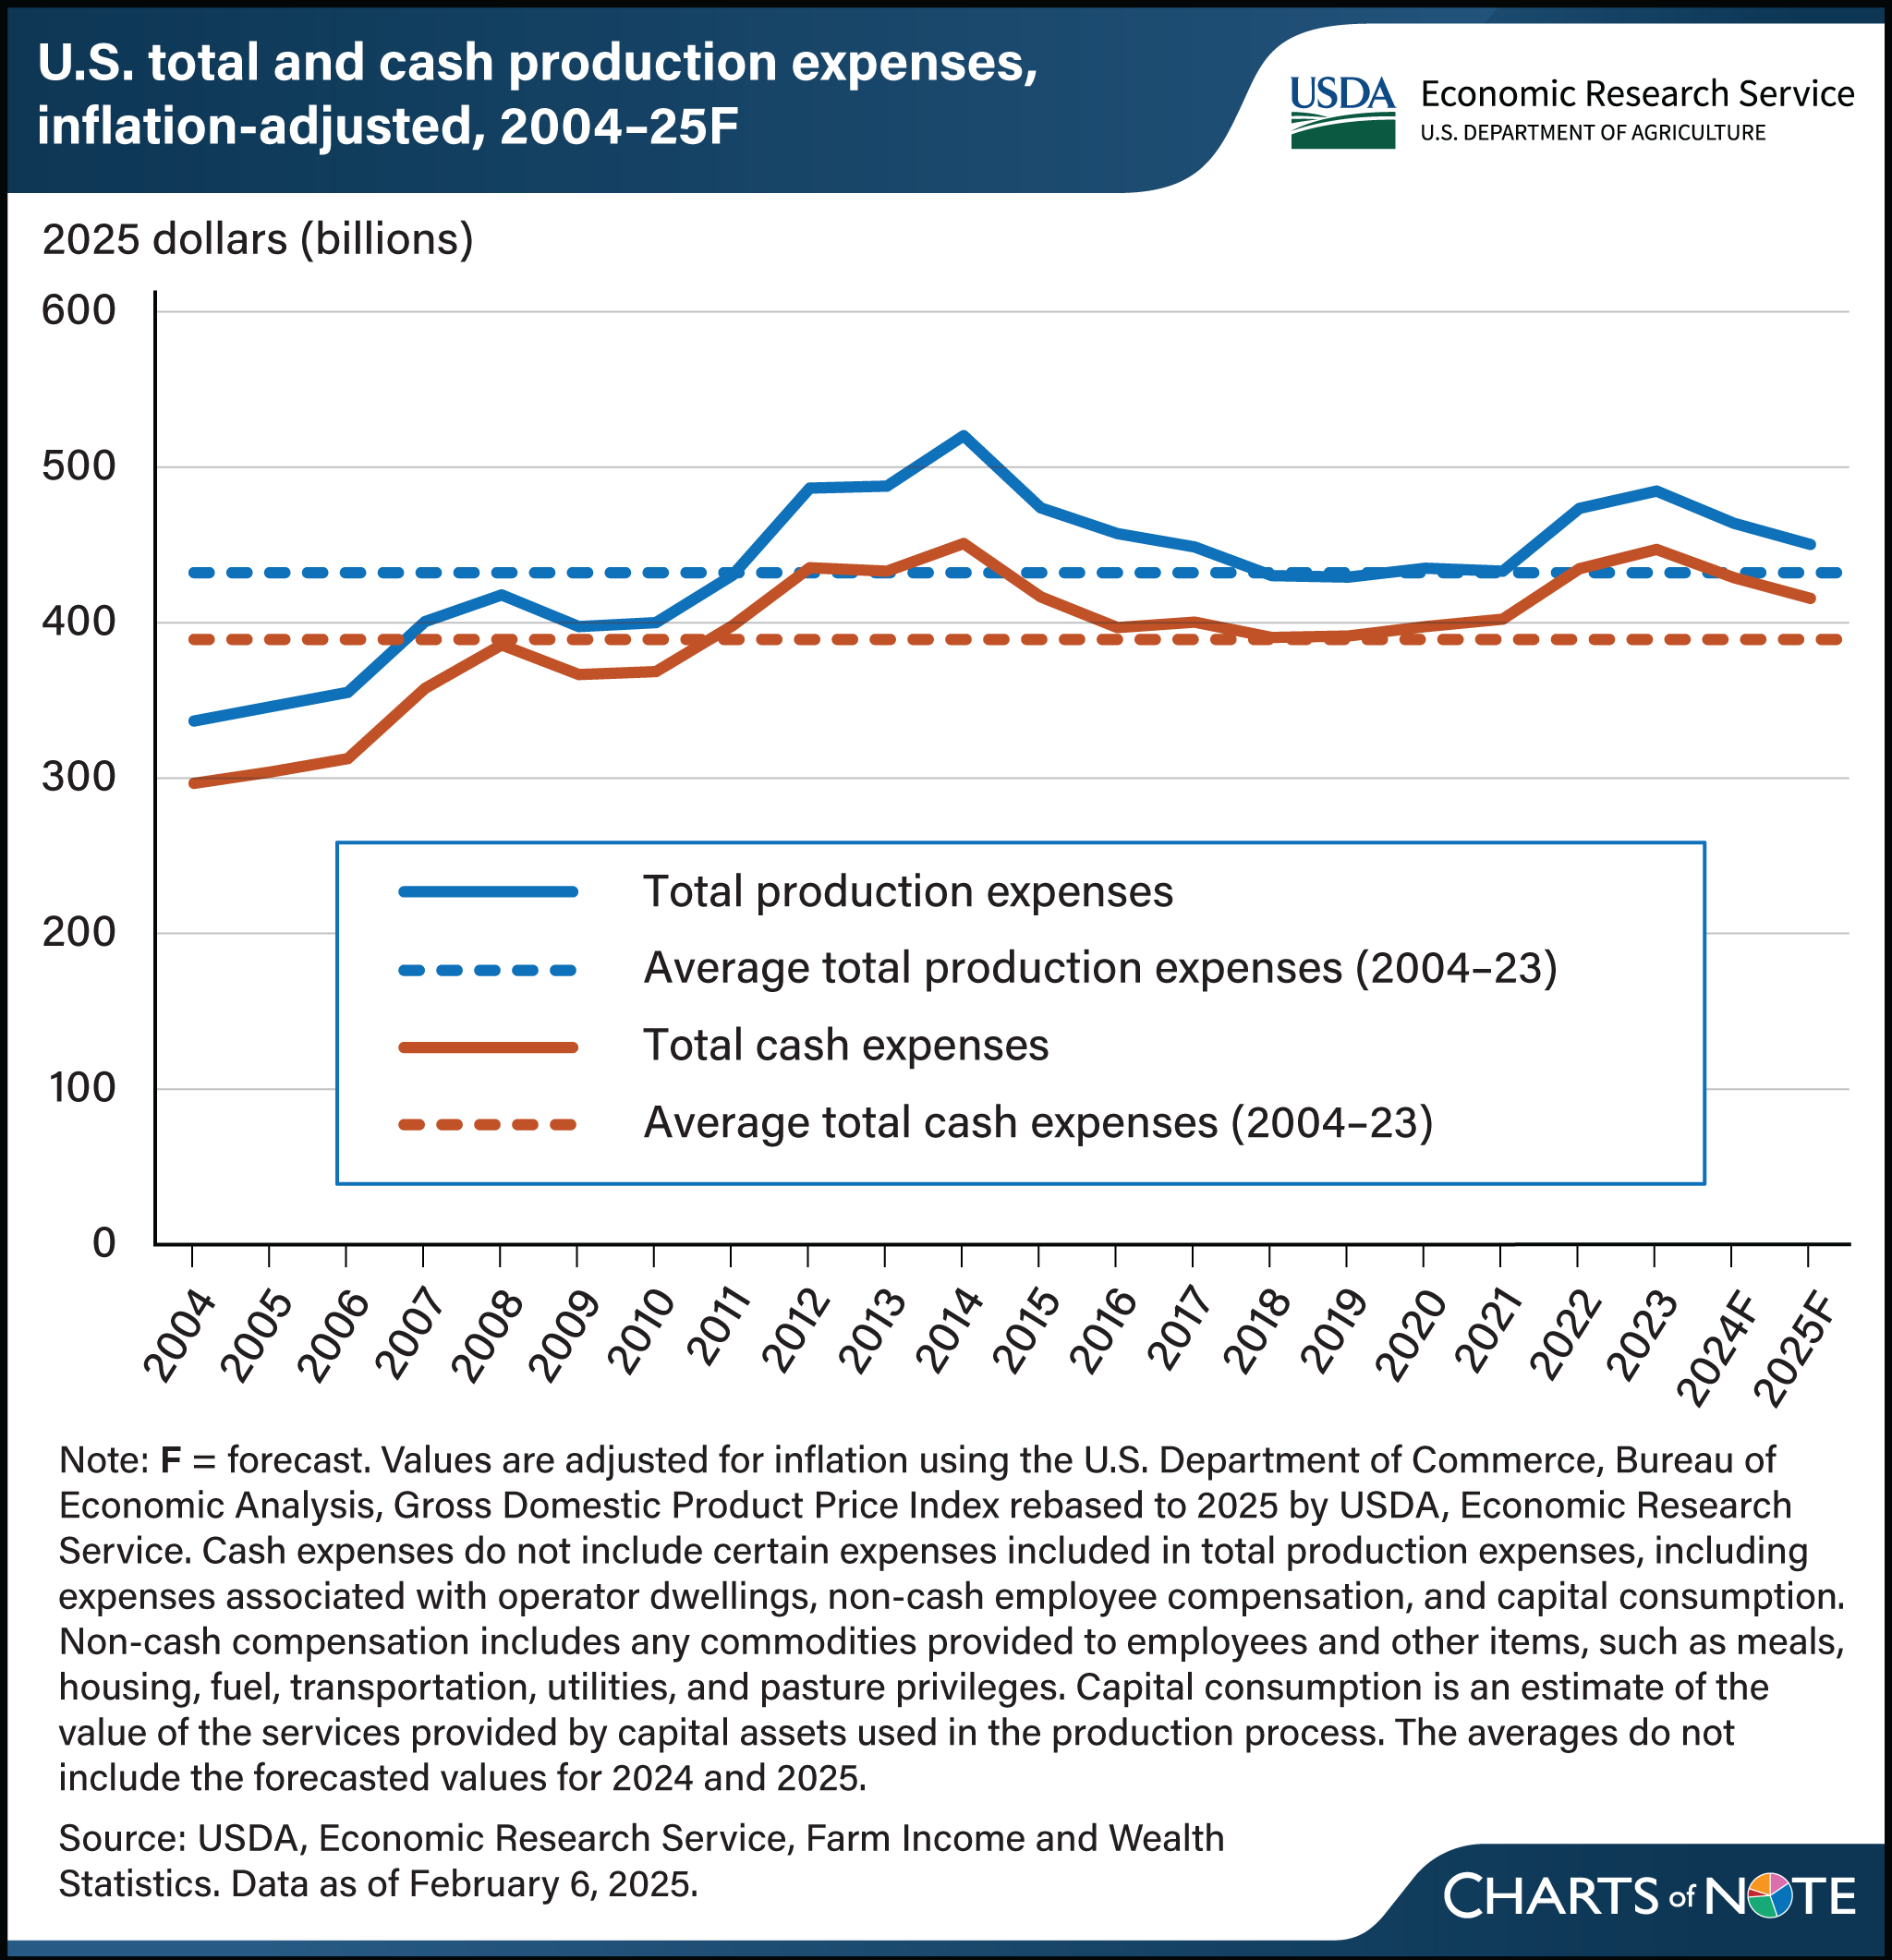
Farm sector production expenses are the costs of all inputs used to produce farm commodities which directly affect farm profitability. In total, these expenses, including those associated with operator dwellings, are forecast to decrease by $13.4 billion (2.9 percent) from $463.8 billion in 2024 to $450.4 billion in 2025 inflation-adjusted dollars. This follows a projected decline of $20.9 billion (4.3 percent) from 2023 to 2024. Lower spending on feed is forecast to account for more than half the decrease in total expenses across both years. However, the forecast declines in expenses in 2024 and 2025 are expected to be less than the increases seen across 2022 and 2023, keeping expenses above the average for 2004–23. As prices paid for most production inputs rose during the Coronavirus (COVID-19) pandemic, total production expenses rose to $484.7 billion in 2023, their highest level since the record high in 2014 of $520.3 billion. Total cash expenses are also forecast to fall in 2024 and 2025 yet remain above average. In 2025, they are projected to be 7 percent above the 2004–23 average and 8 percent below the record high in 2014. Find additional information and analysis on the USDA, Economic Research Service Farm Sector Income and Finances topic page containing data released on February 6, 2025.