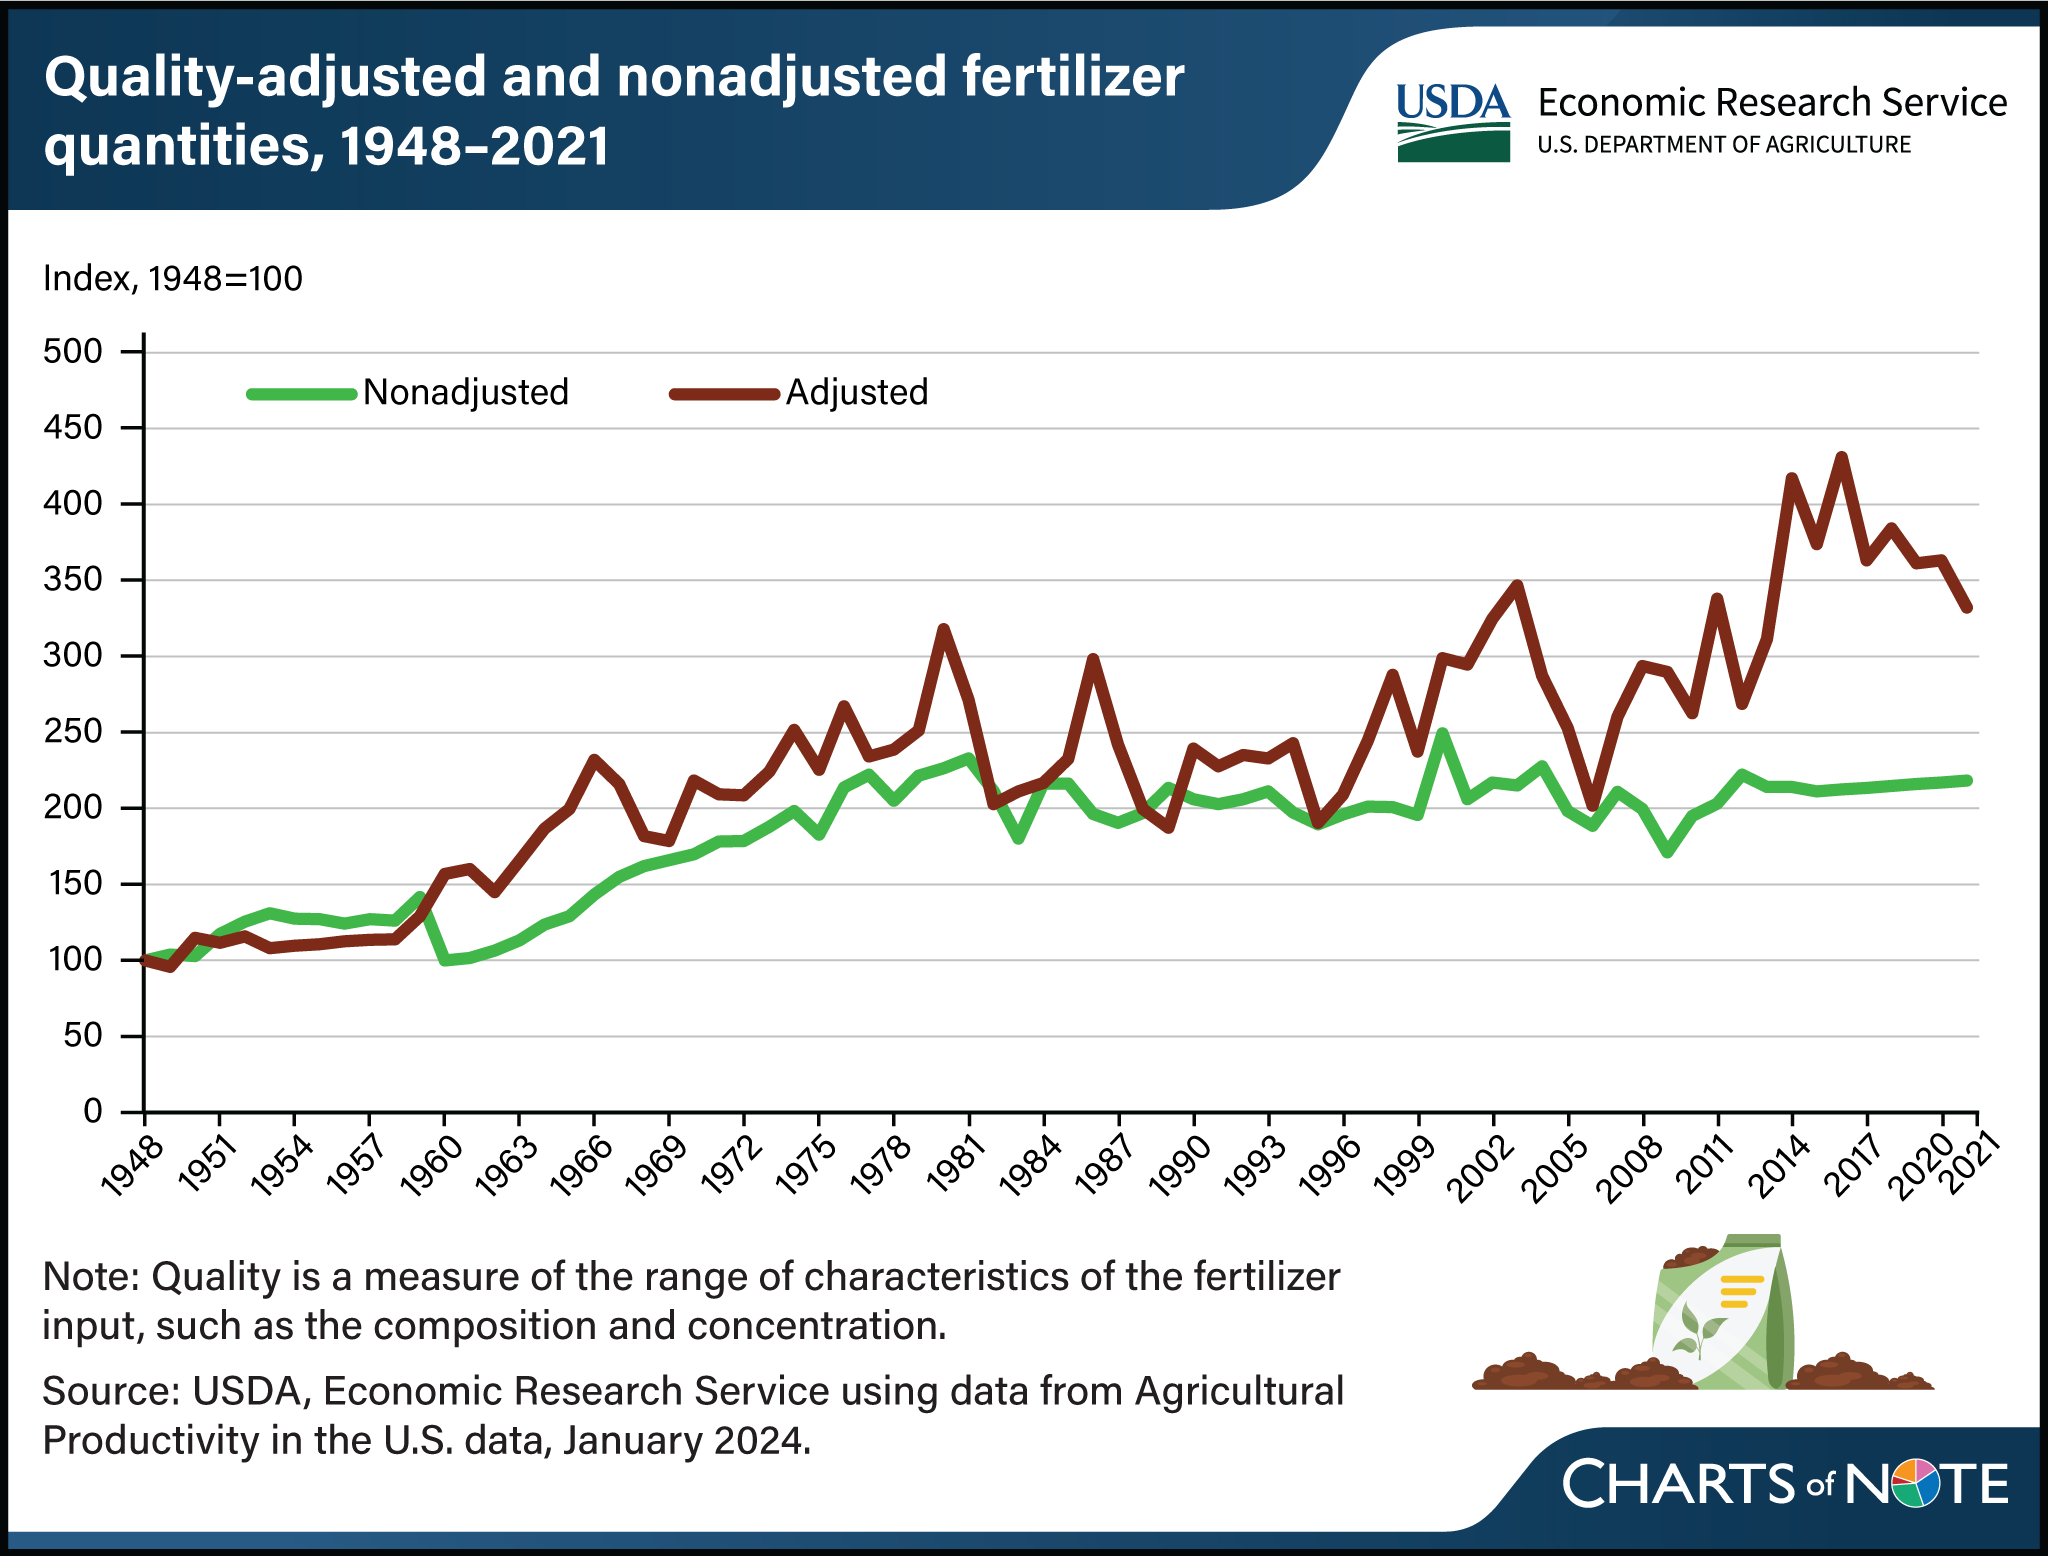
Fertilizer quality has improved over time
- by Eric Njuki, Roberto Mosheim and Richard Nehring
- 11/20/2024

Chemical fertilizers have undergone significant changes in the composition and concentration of nitrogen, phosphorus, and potash over time. These quality changes mean that current fertilizers can be more effective than past ones, making it difficult to calculate the productivity of the agricultural sector from year to year. To accurately account for the role of fertilizer in agricultural productivity, USDA, Economic Research Service (ERS) researchers adjust for the changes in composition and concentration of fertilizer. They find that farmers used 2 times more fertilizer in 2021 than in 1948 when unadjusted for quality, and 2.5 times more fertilizer once adjusted for quality. The trend of increased fertilizer use for both unadjusted and adjusted quality can be partially explained by relative price changes between fertilizer and other inputs, which prompted producers to increase fertilizer use compared with other inputs, such as land and labor. For more on U.S. agricultural productivity trends, see the ERS topic page Agricultural Research and Productivity and the ERS data product Agricultural Productivity in the United States. This chart updates data appearing in the ERS report Measurement of Output, Inputs, and Total Factor Productivity in U.S. Agricultural Productivity Accounts, published in August 2024.
We’d welcome your feedback!
Would you be willing to answer a few quick questions about your experience?

