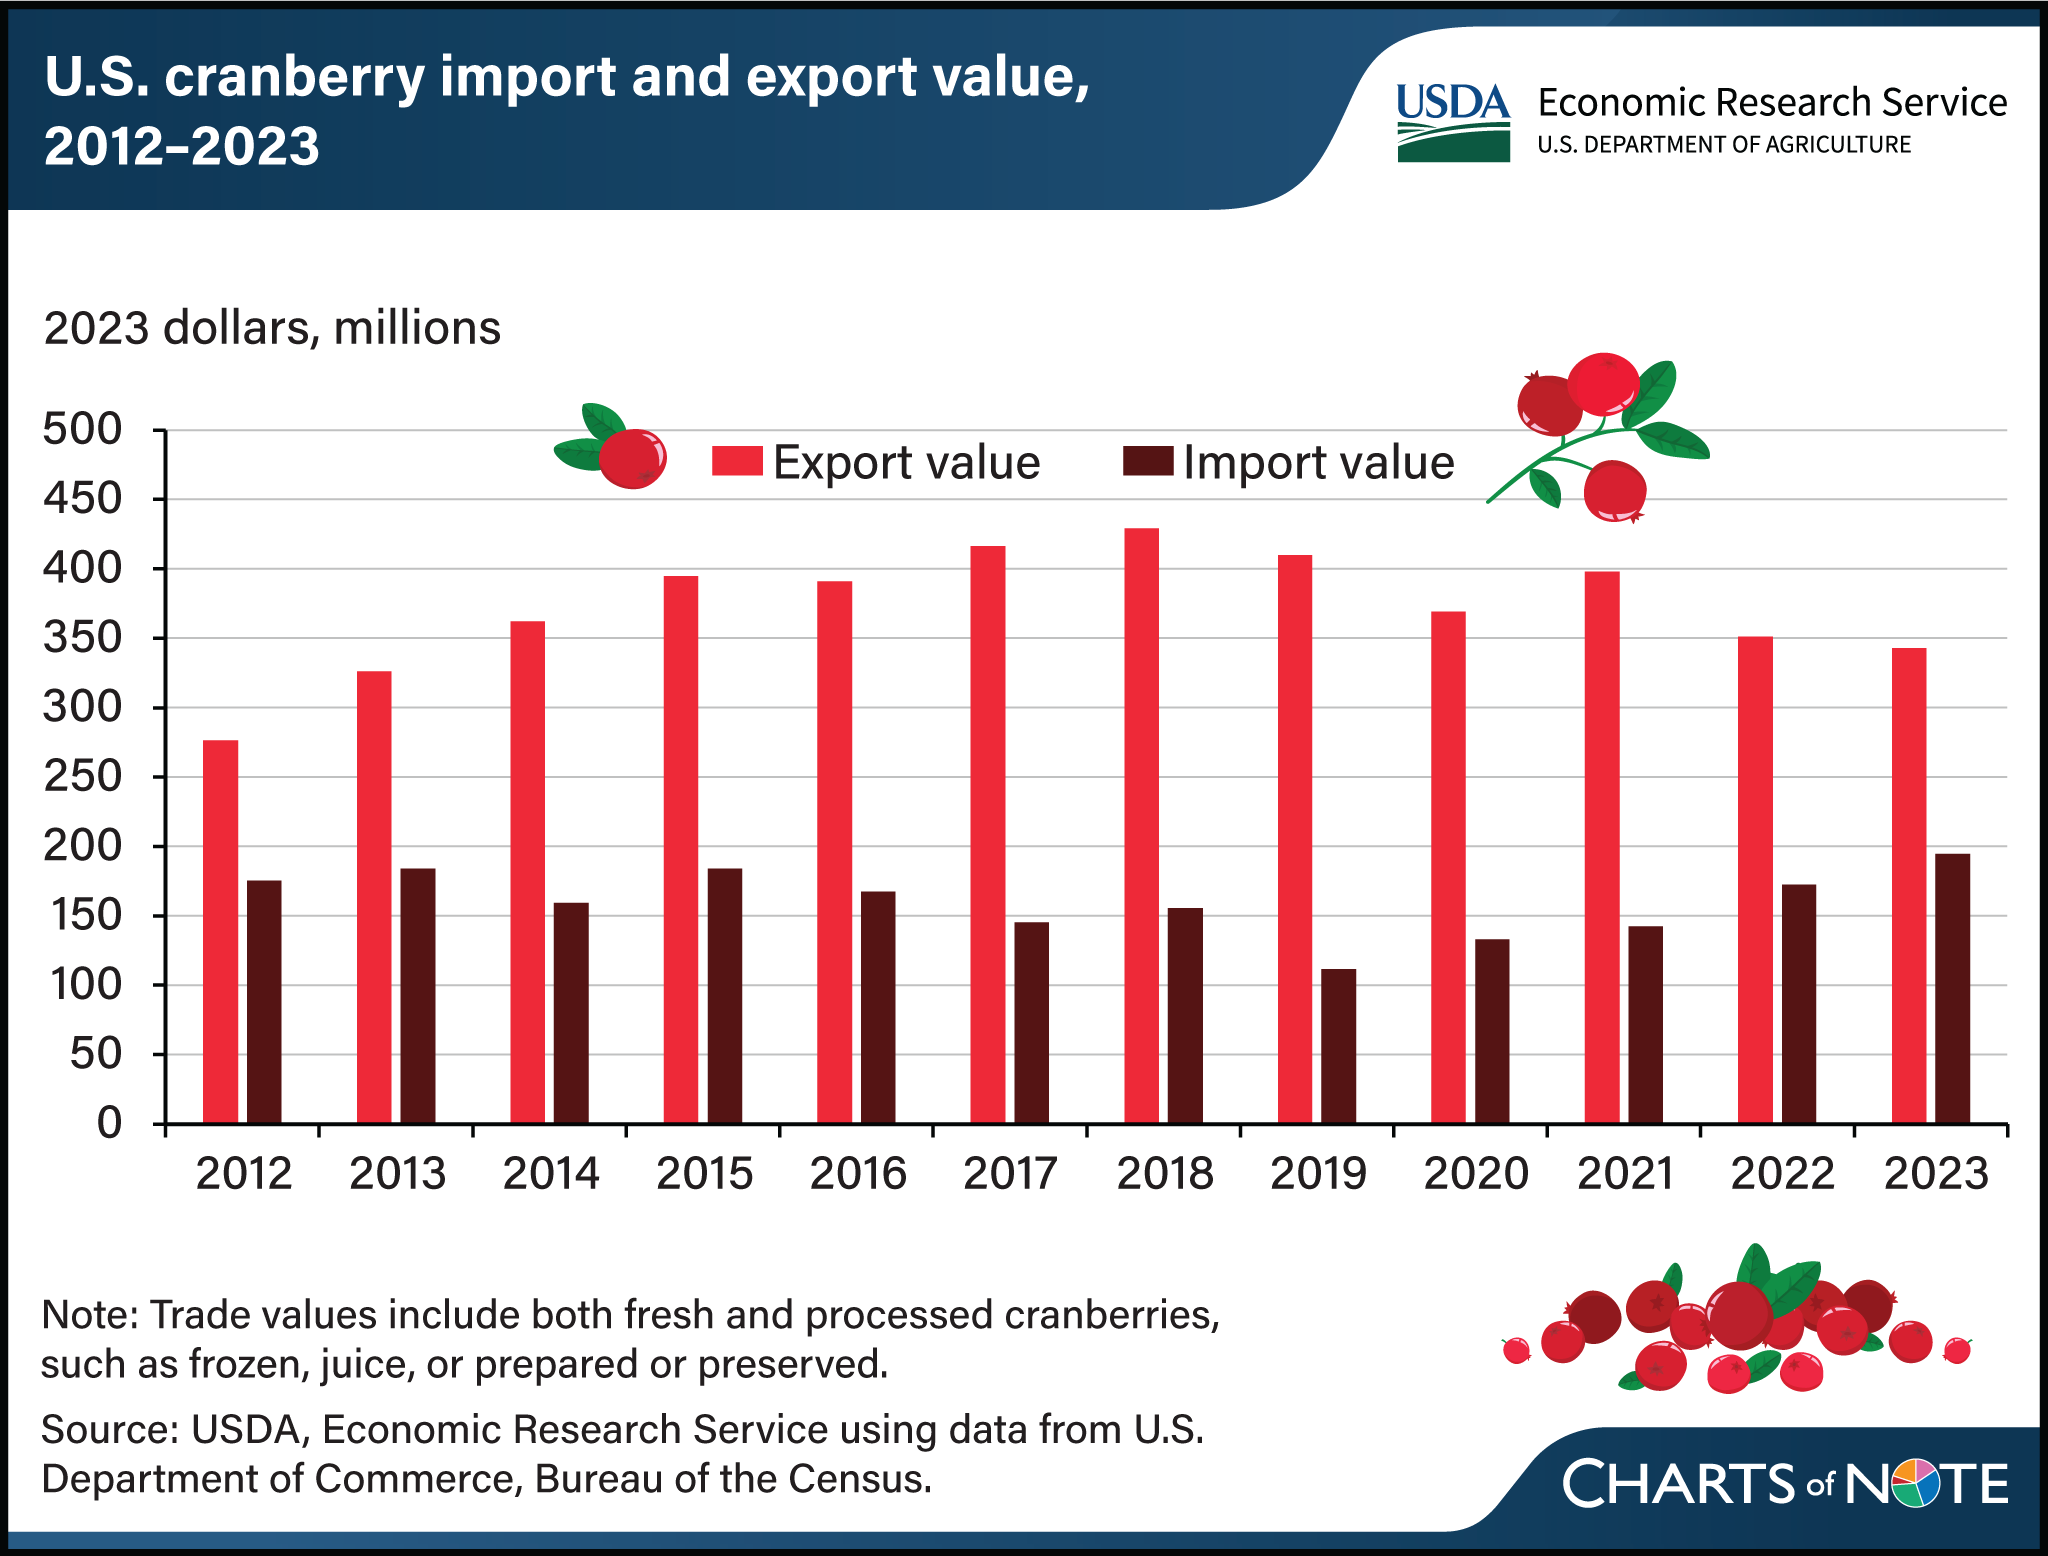
U.S. cranberry exports valued at $343 million in 2023, down from 2018 peak
- by Helen Wakefield
- 11/21/2024

The United States produces about two-thirds of the world’s cranberries, based on 2018–22 data from the Food and Agriculture Organization of the United Nations. In 2023, the United States exported $343.1 million of cranberries. Adjusting for inflation, the value of U.S. cranberry exports was 2 percent lower than 2022 and $85.9 million lower than the 2018 high. Processed cranberry products, like cranberry sauce or juice, make up about 95 percent of the value of all U.S. cranberry exports. These processed cranberry products were largely destined for Canada, Mexico, China, and the Netherlands. Prepared or preserved cranberry exports, valued at $267.6 million, accounted for 78 percent of cranberry export value. Meanwhile, cranberry juice exports were valued at $57.1 million. The United States also imports cranberries, with almost all imported cranberries and cranberry products entering from Canada. In 2023, the United States imported $194.5 million of cranberries, up from the inflation-adjusted low of $111.7 million in 2019. While processed cranberry products are imported throughout the year, fresh cranberry trade is highly seasonal, with volumes spiking in autumn ahead of the holiday season. This chart is based on the USDA, Economic Research Service Fruit and Tree Nuts Outlook Report, released September 2024.

