Specialty crop farms have highest labor cost as portion of total cash expenses
- by Dipak Subedi and Anil K. Giri
- 10/15/2024

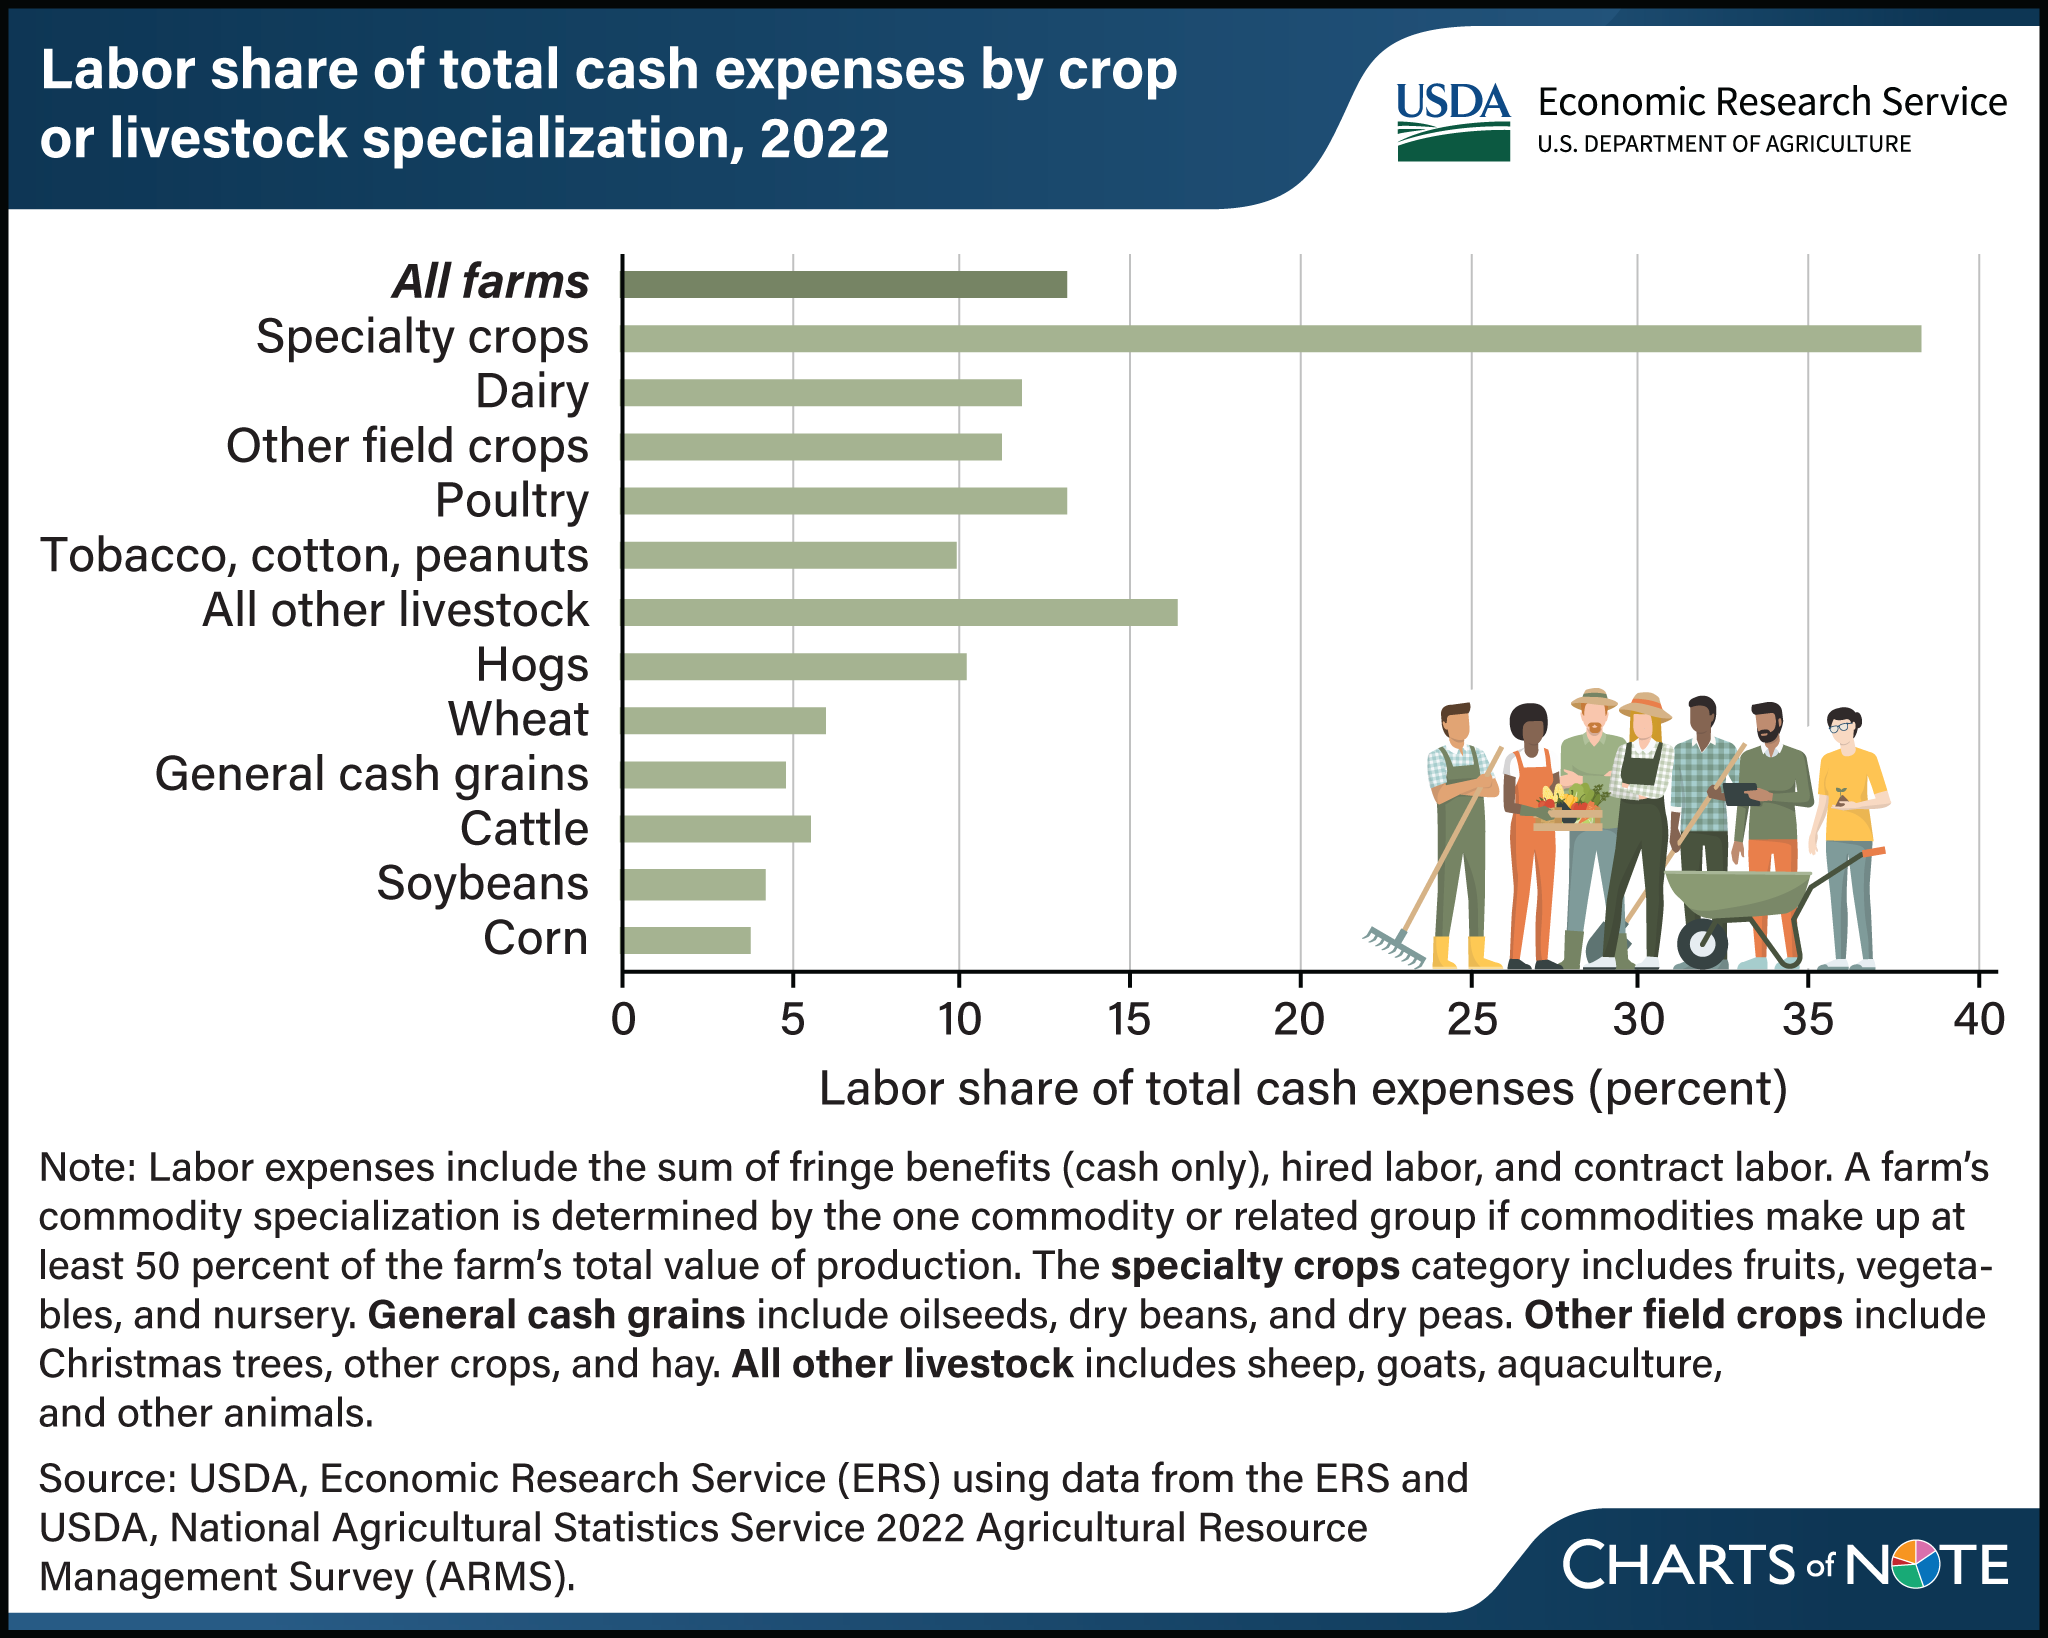
A farm’s reliance on labor varies by commodity specialization. On average, labor costs (including contract labor, hired labor, and worker benefits, such as insurance) accounted for about 13 percent of total farm cash expenses in 2022. Farms specializing in the production of specialty crops, which include fruits, tree nuts, vegetables, beans (pulses), and horticultural nursery crops, had the highest labor costs across farm types, with labor accounting for 38 cents of every dollar in cash expenses. In contrast, operations specializing in corn and soybeans spent the least on labor costs as a percentage of total cash farm expenses in 2022, with each farm spending 4 cents of every dollar of cash expenses on labor. Corn and soybean farms have lower farm labor expenses resulting from higher adoption rates of labor-saving innovations such as technology and chemical herbicides. Among livestock specialized farms, poultry and dairy farms spent the highest share at 13 and 12 percent of total cash expenses, respectively, on labor. Cattle producers spent the least (6 percent of total cash expenses) among livestock specialized farms. This chart updates information in the USDA, Economic Research Service report America’s Diverse Family Farms: 2021 Edition, published in December 2021.

