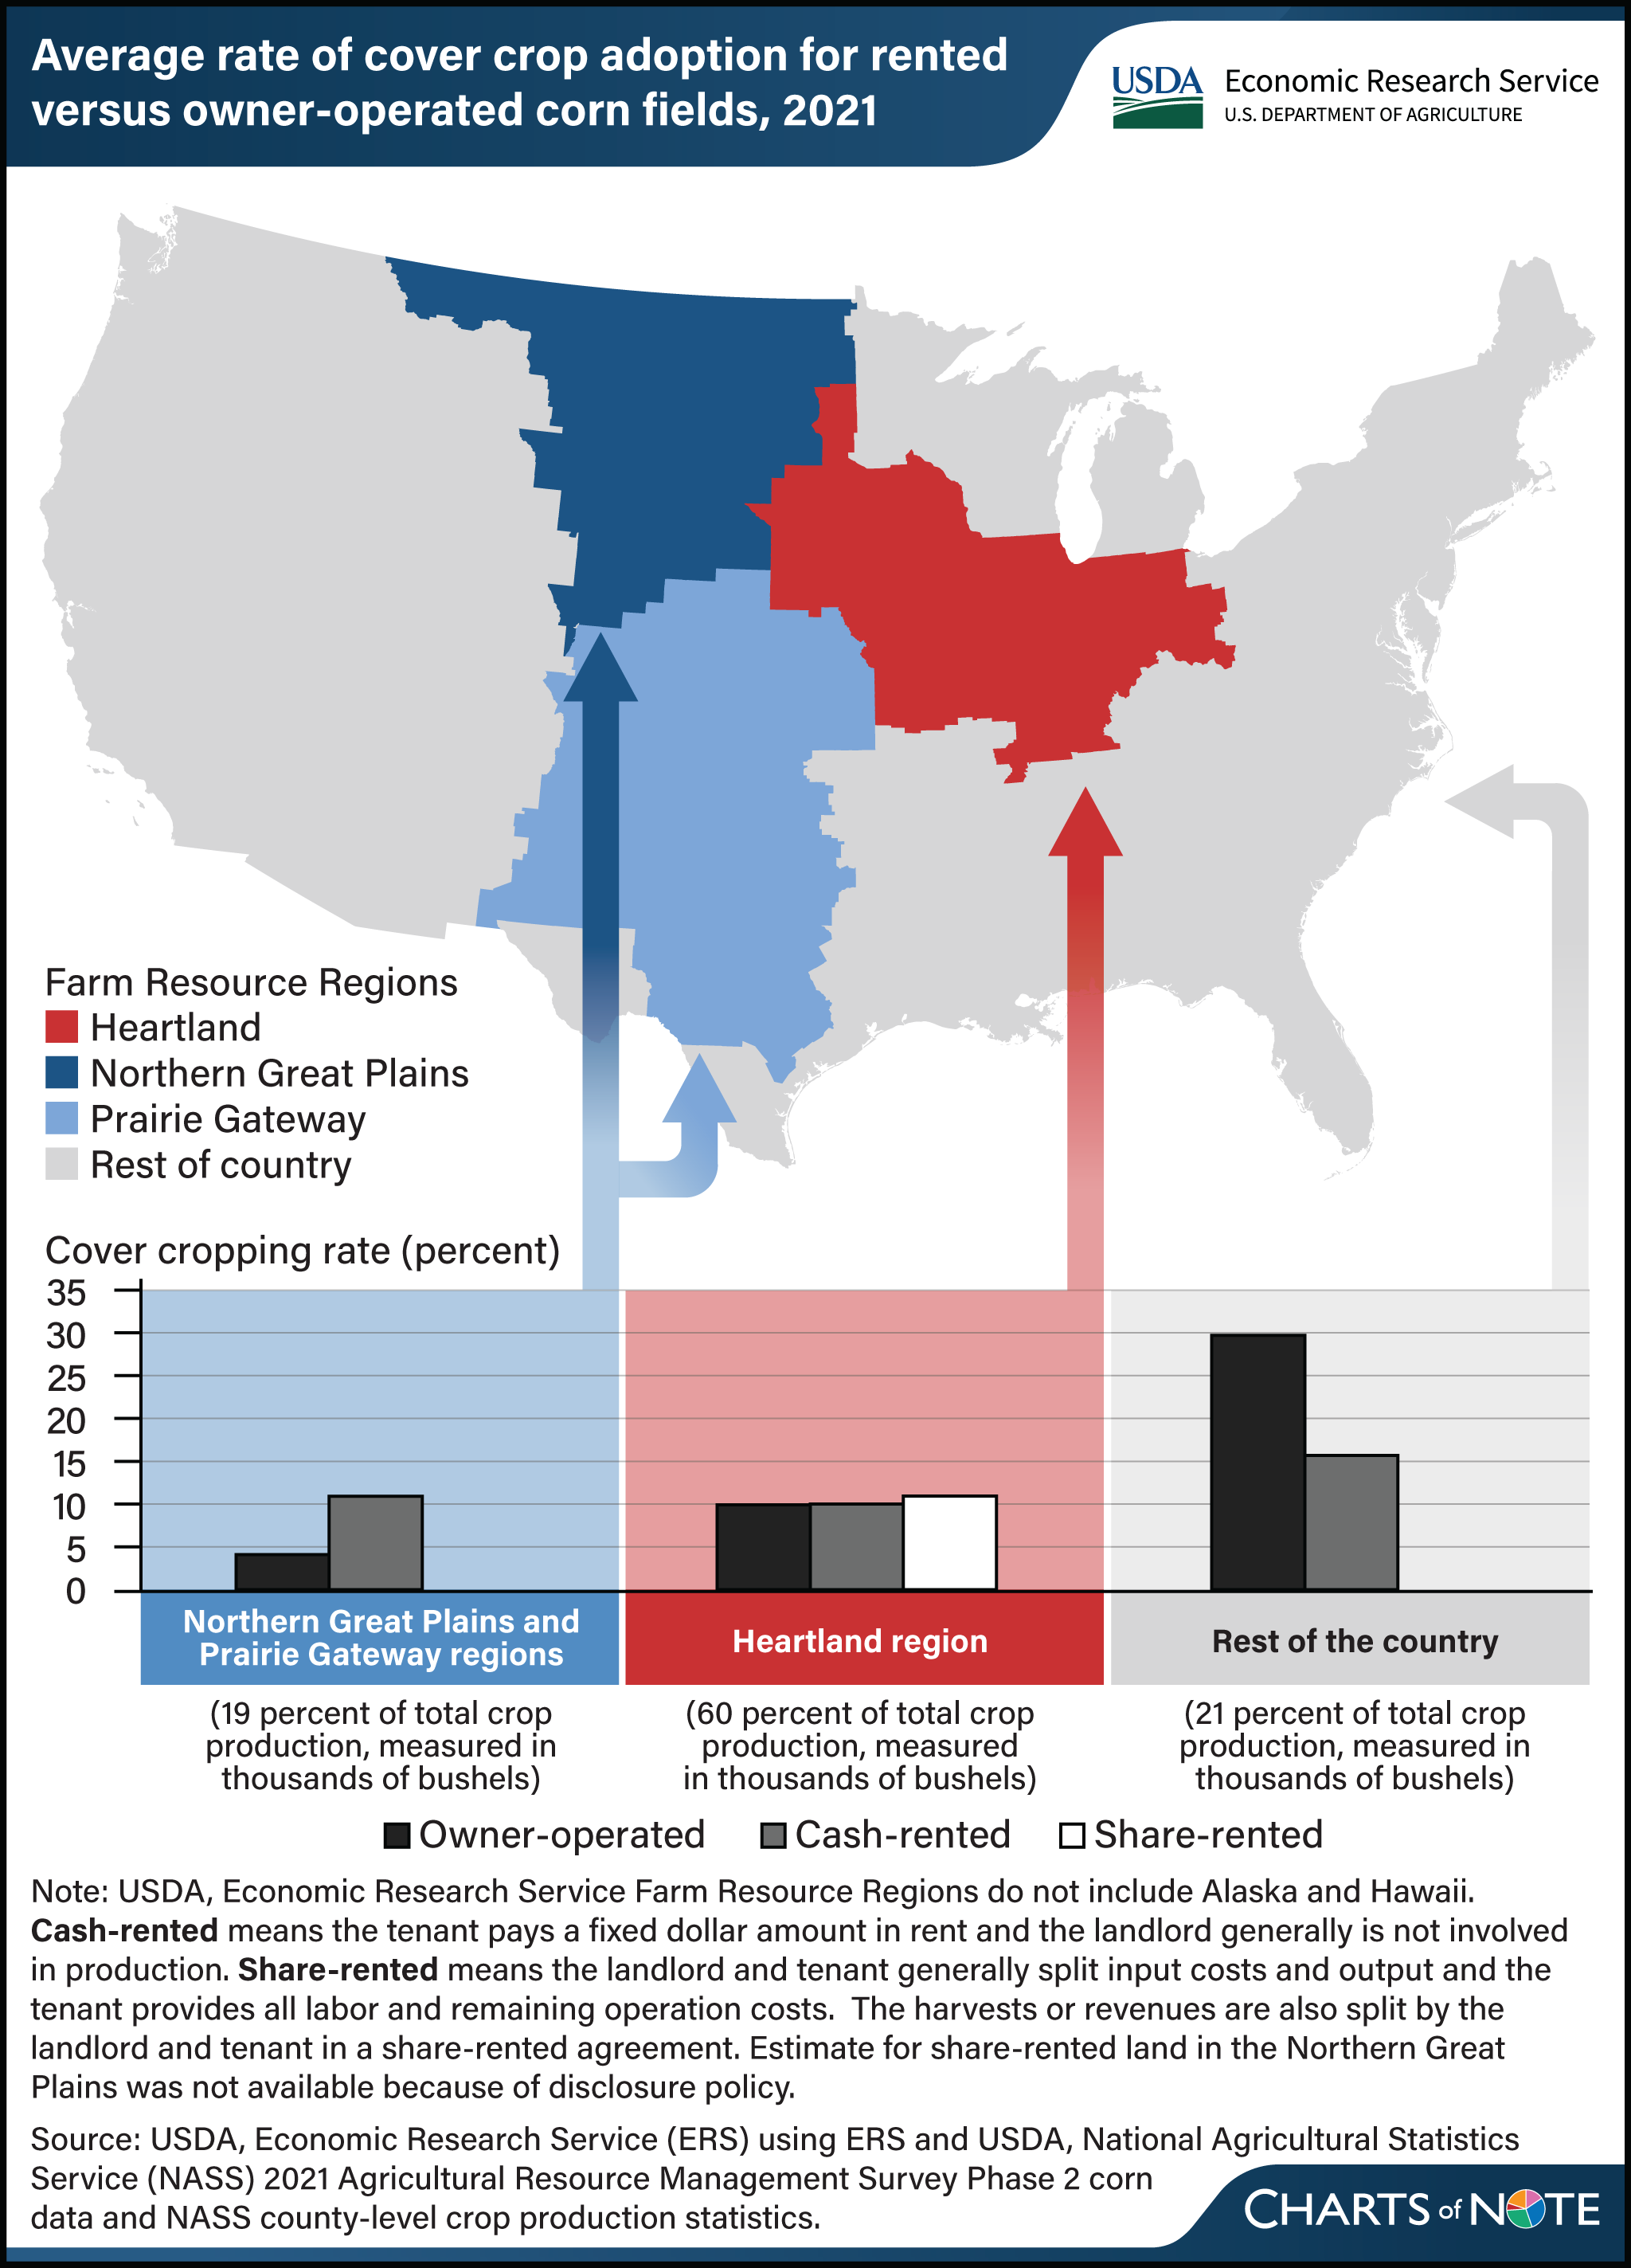
Cover crop adoption rates vary across regions and tenure in corn production
- by Daniel Szmurlo and J. Wesley Burnett
- 8/19/2024

The rates of adoption for cover crops vary across regions and the way land is managed. To illustrate this, researchers with USDA, Economic Research Service (ERS) depicted the geographic variation of survey data collected for corn-growing fields in 2021. Land in the Heartland region had adoption rates of around 10 percent for all owner-operated, cash-rented, and share-rented fields. Land in the Northern Great Plains and Prairie Gateway regions had adoption rates of around 4 percent for owner-operated fields and 11 percent for cash-rented fields. The rest of the country (any land outside of the Heartland, Great Plains, and Prairie Gateway Resource regions) had 30 percent cover crop adoption for fields operated by owner-operators and 16 percent of fields operated by cash renters, respectively. No surveyed share-rented fields in the “rest of the country” region adopted cover crops. According to the 2022 Census of Agriculture, there were 18.0 million acres of cover crops planted in 2022, a number that has grown over the last decade. More information on land leasing can be found in the ERS report Farmland Rental and Conservation Practice Adoption, published in March 2024.

