Owner-operators and cash-rent farmers lead cover crop adoption
- by Daniel Szmurlo and J. Wesley Burnett
- 7/17/2024

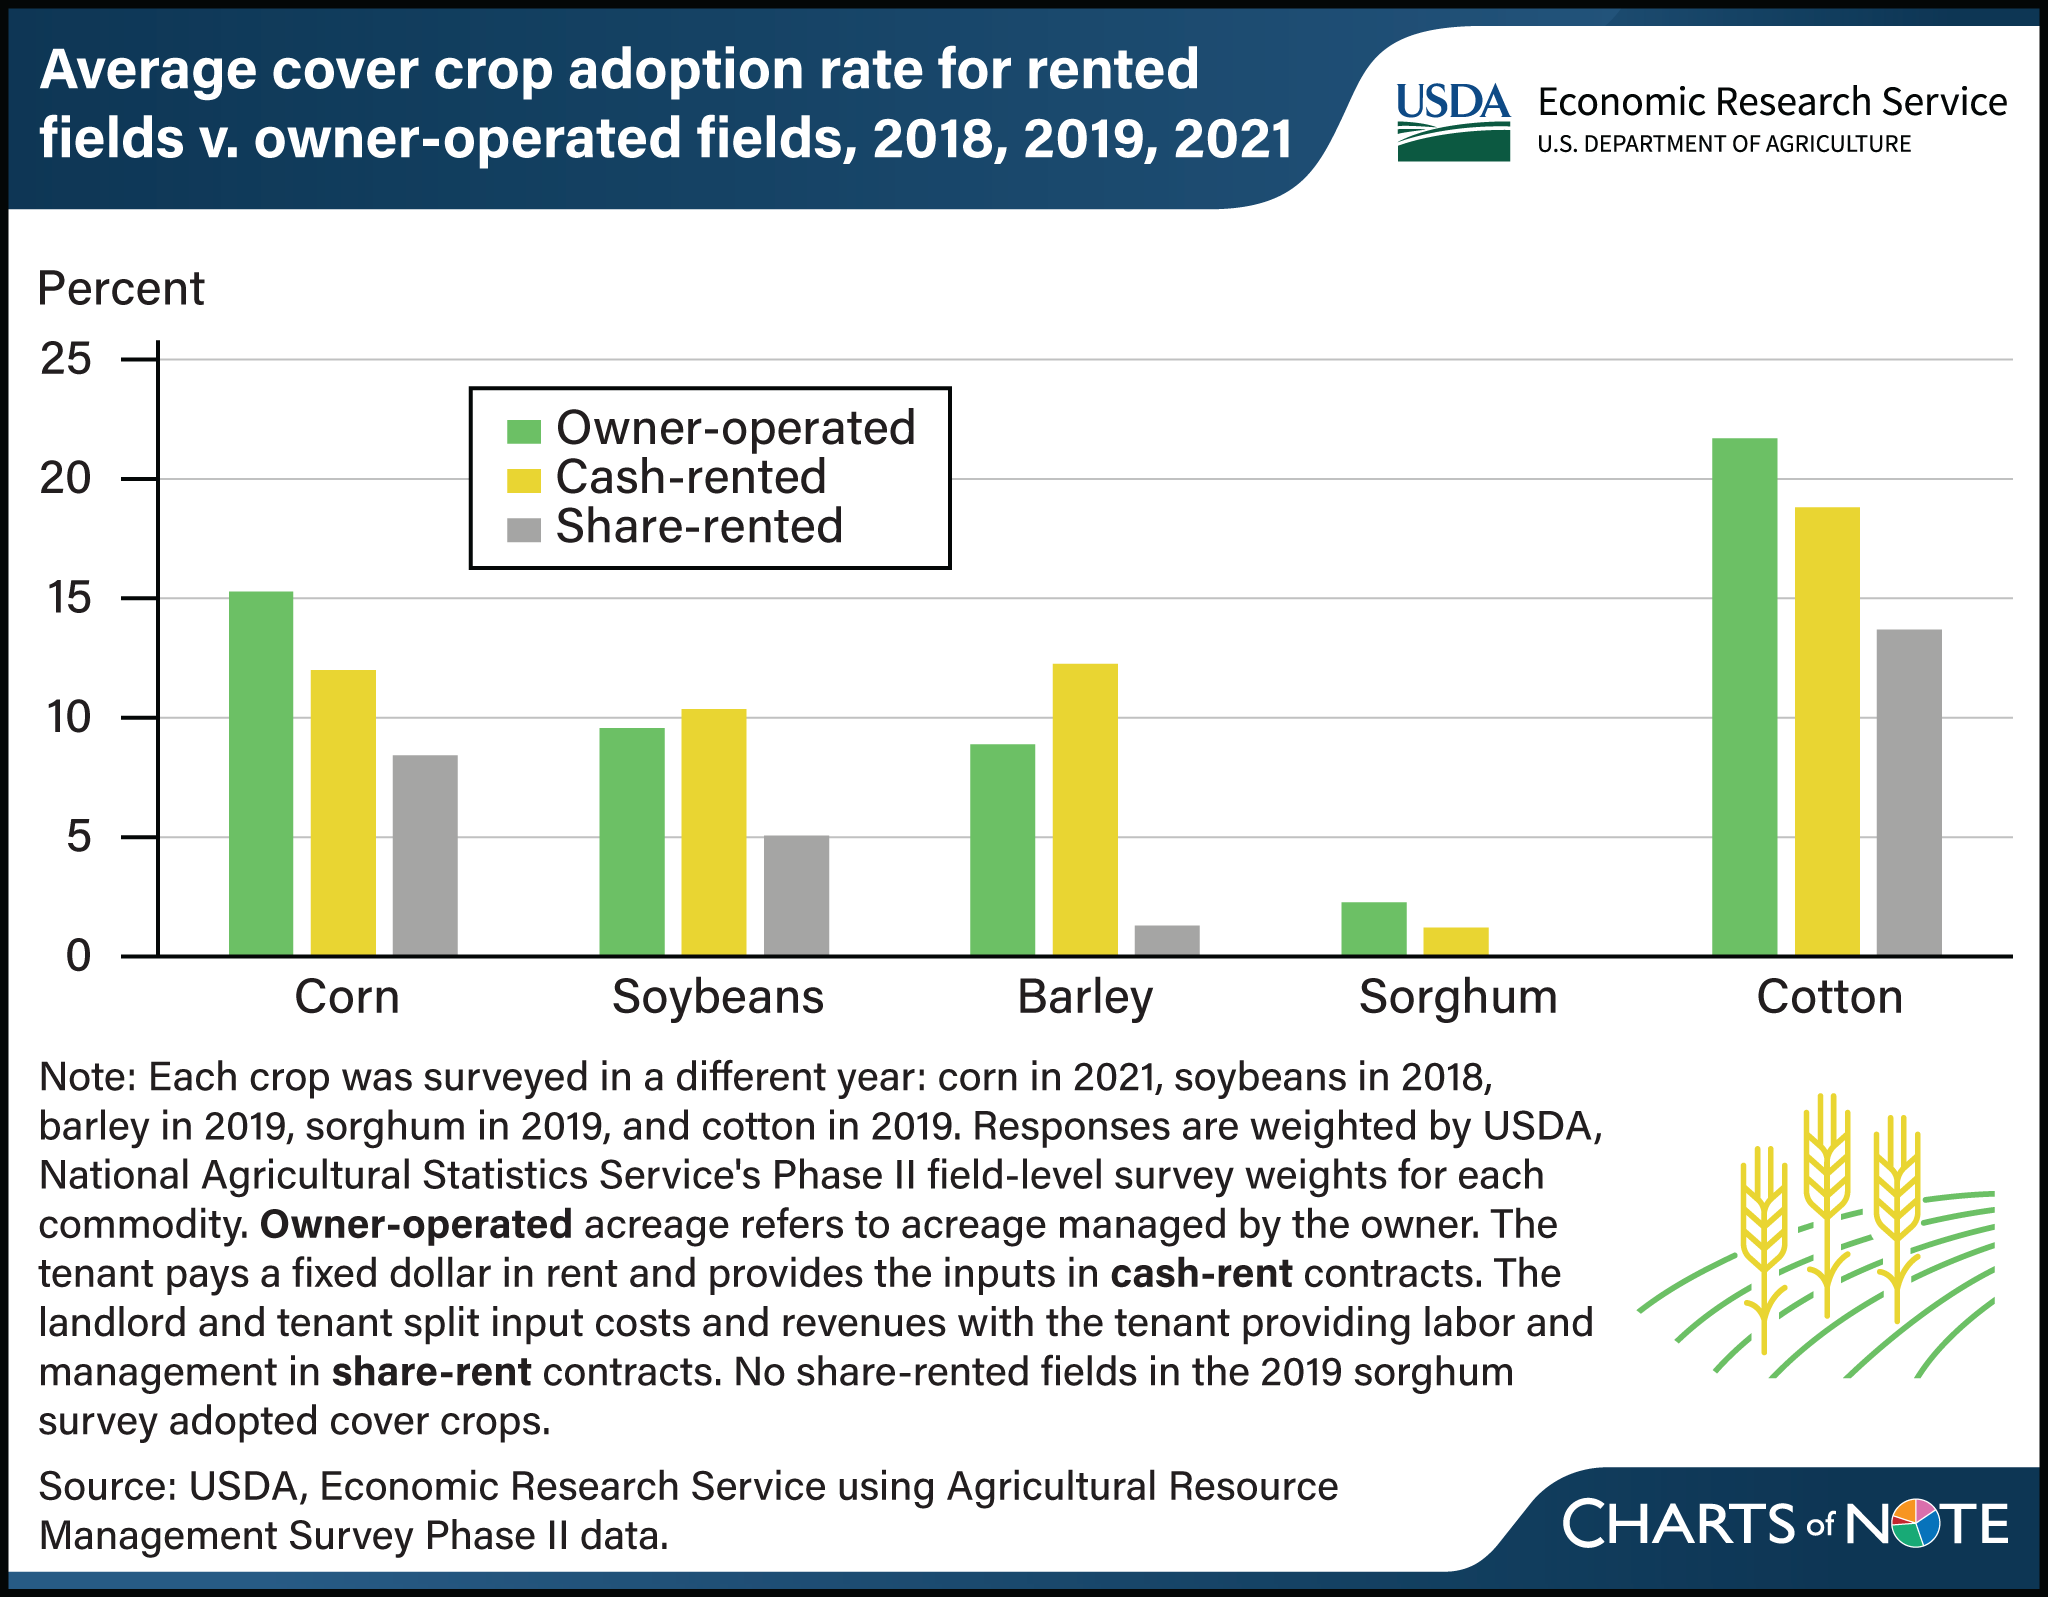
Cash-renters and owner-operators adopt cover crops at rates higher than share-renters. Researchers with USDA’s Economic Research Service (ERS) explored whether adopting cover crops (a crop grown between two commodity or forage crops but unharvested/terminated with the intention of improving soil health) differed between farmers who owned the land they farmed and those who were renters, whether under a cash- or share-rent agreement. Using data from USDA’s Agricultural Resource Management Survey (ARMS), researchers calculated national-level statistics for five crops. They found that owner-operated cotton fields had the highest rates of cover crop adoption for owned land, with 22 percent of owner-operated cotton fields having cover crops in 2019. Owner-operated fields nominally led cash-rented fields in cover cropping for cotton, corn, and sorghum, but trailed cash-rented fields for soybeans and barley. Owner-operated fields exceeded share-rented fields in cover crop adoption for all five commodity crops surveyed. About 40 percent of farmland in the contiguous 48 States is rented. Information on the use of various rental agreements, as well as conservation tillage and structural practice adoption, can be found in the ERS report Farmland Rental and Conservation Practice Adoption, published in March 2024.
We’d welcome your feedback!
Would you be willing to answer a few quick questions about your experience?

