
Productivity growth is the major driver of U.S. agricultural growth
- by Sun Ling Wang
- 2/13/2024
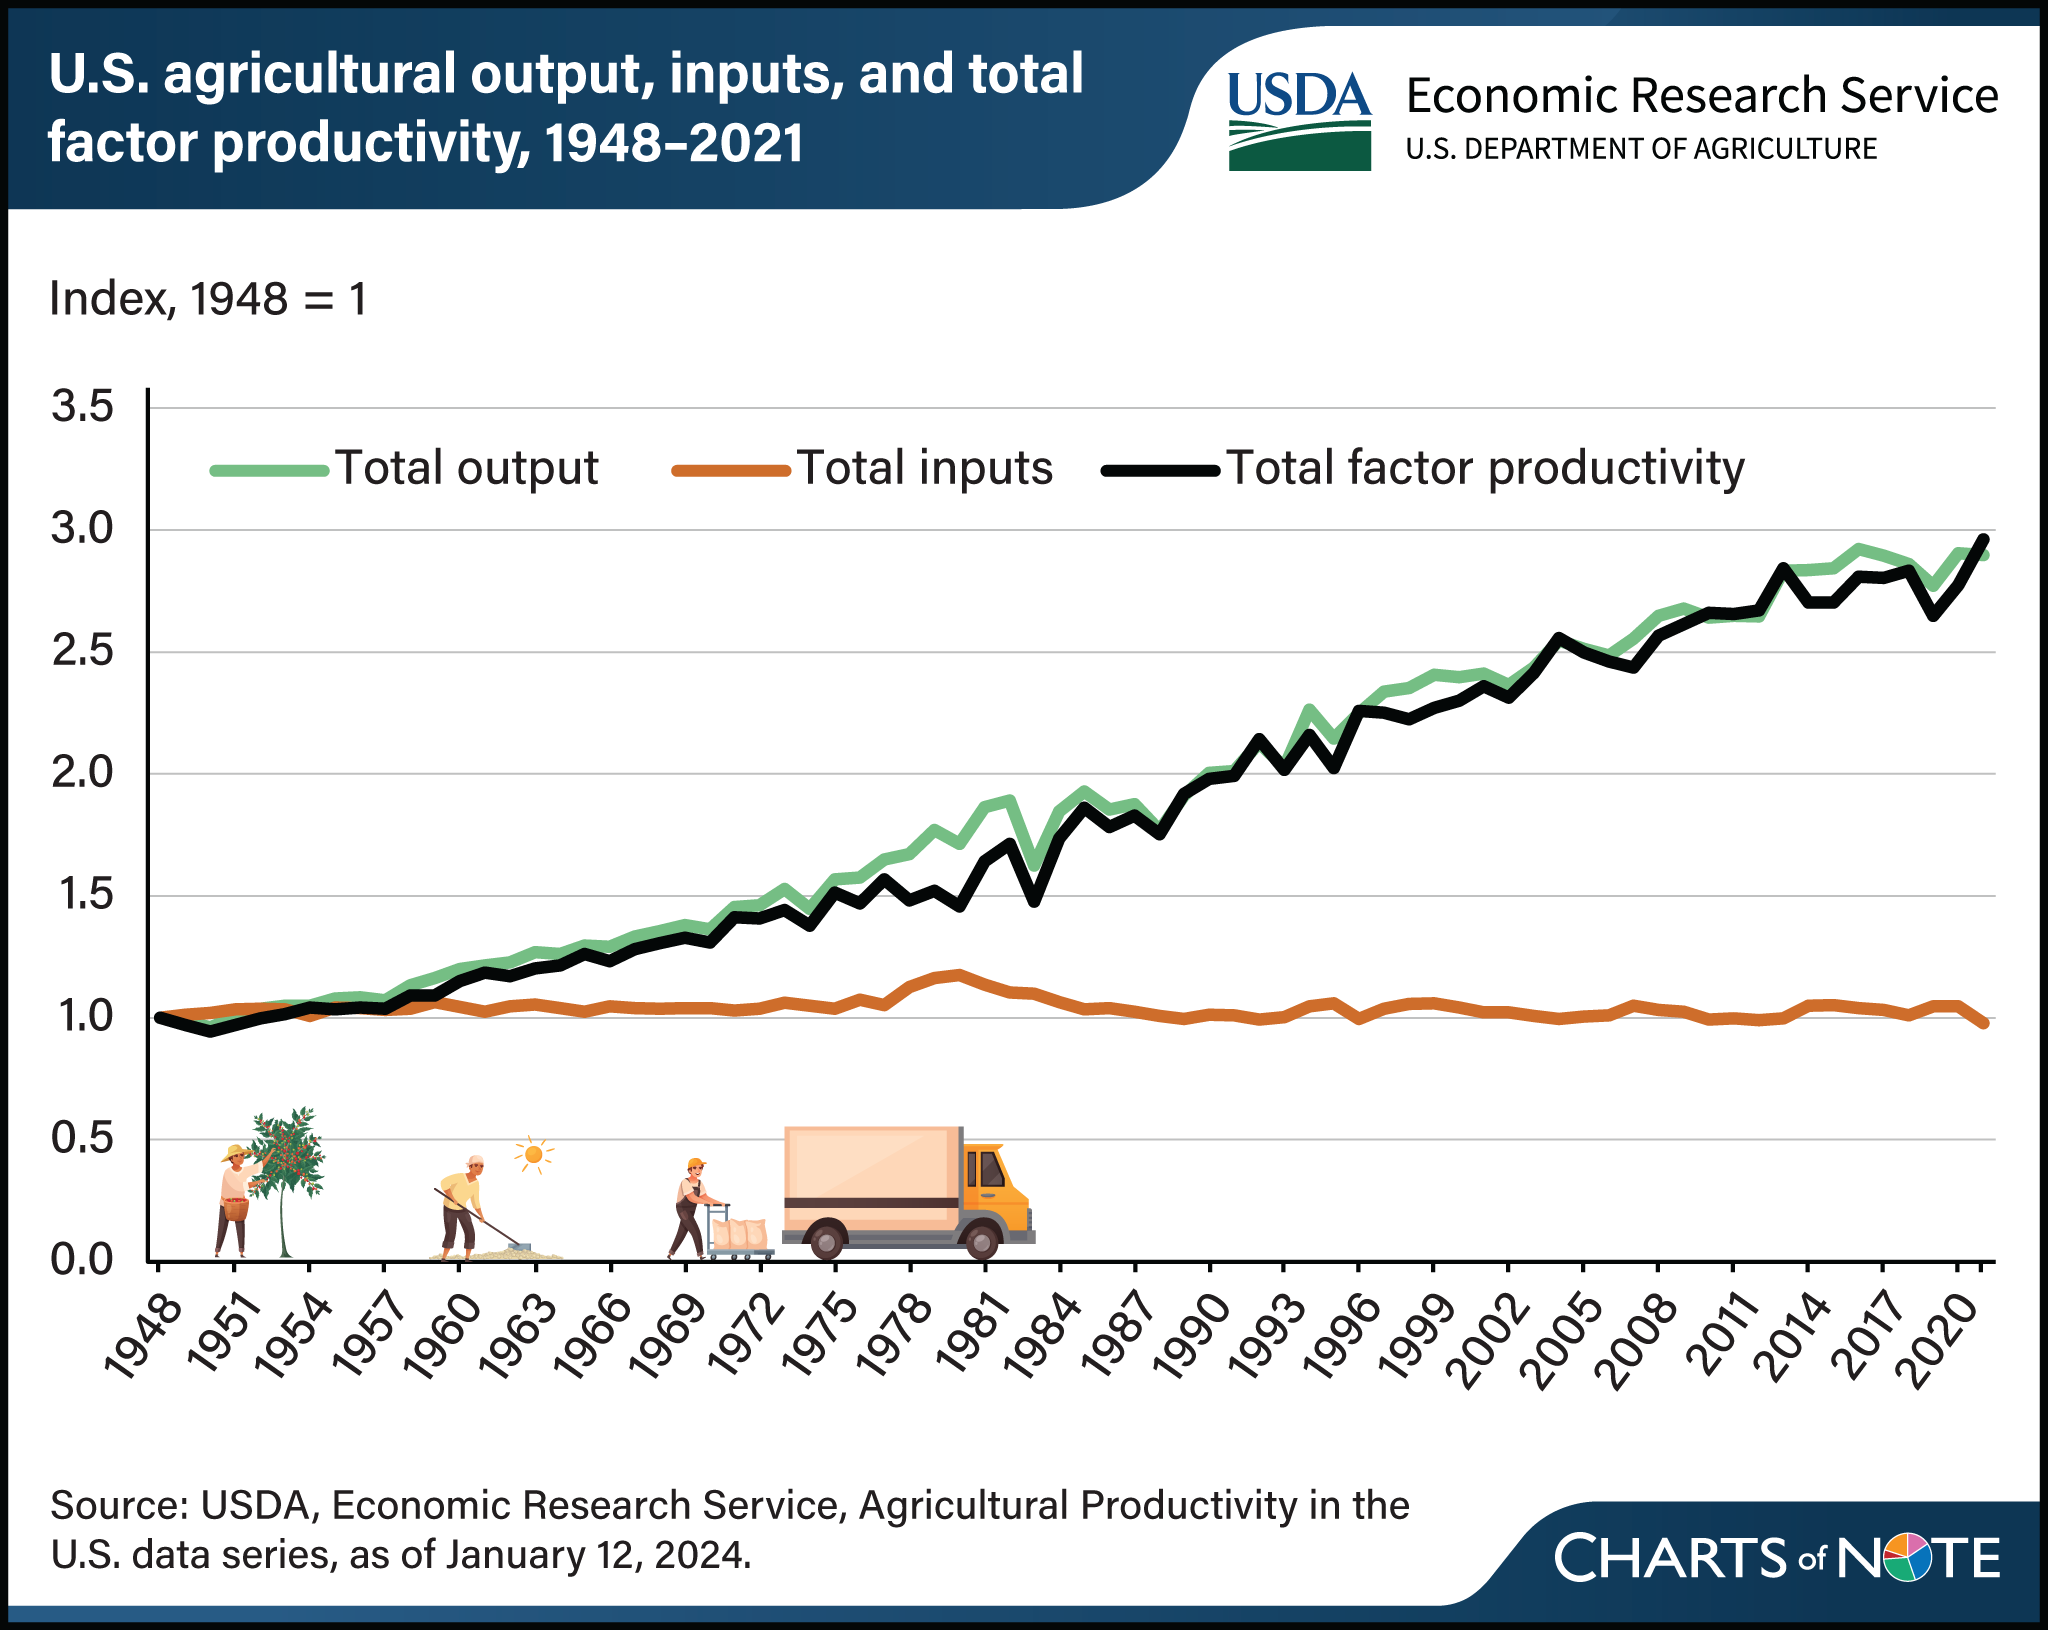
Technological developments in agriculture have enabled continued output growth without requiring much additional inputs. Innovations in animal and crop genetics, chemicals, equipment, and farm organization have made it possible for total agricultural output to nearly triple between 1948 and 2021. During that period, the amount of inputs used in farming declined slightly over time, meaning that the growth in agricultural output over the long term has depended on increases in total factor productivity (TFP). TFP measures the amount of agricultural output produced from the combined inputs (land, labor, capital, and intermediate inputs) employed in farm production. Therefore, growth in TFP indicates positive changes in the efficiency with which inputs are transformed into outputs. It can also be seen as an indicator of technical change. In the short term, total output growth and estimated TFP growth can be affected by random events, such as adverse weather. In the most recent TFP calculation period spanning 2020–21, agricultural output grew, which was due entirely to TFP growth, even as the amount of inputs used in farming fell. This figure appears in the Agricultural Productivity in the U.S.: Summary of Recent Findings updated in January 2024.
We’d welcome your feedback!
Would you be willing to answer a few quick questions about your experience?