
Inflation-adjusted monthly U.S. food spending in 2021 surpasses pre-pandemic levels
- by Wilson Sinclair and Eliana Zeballos
- 1/21/2022
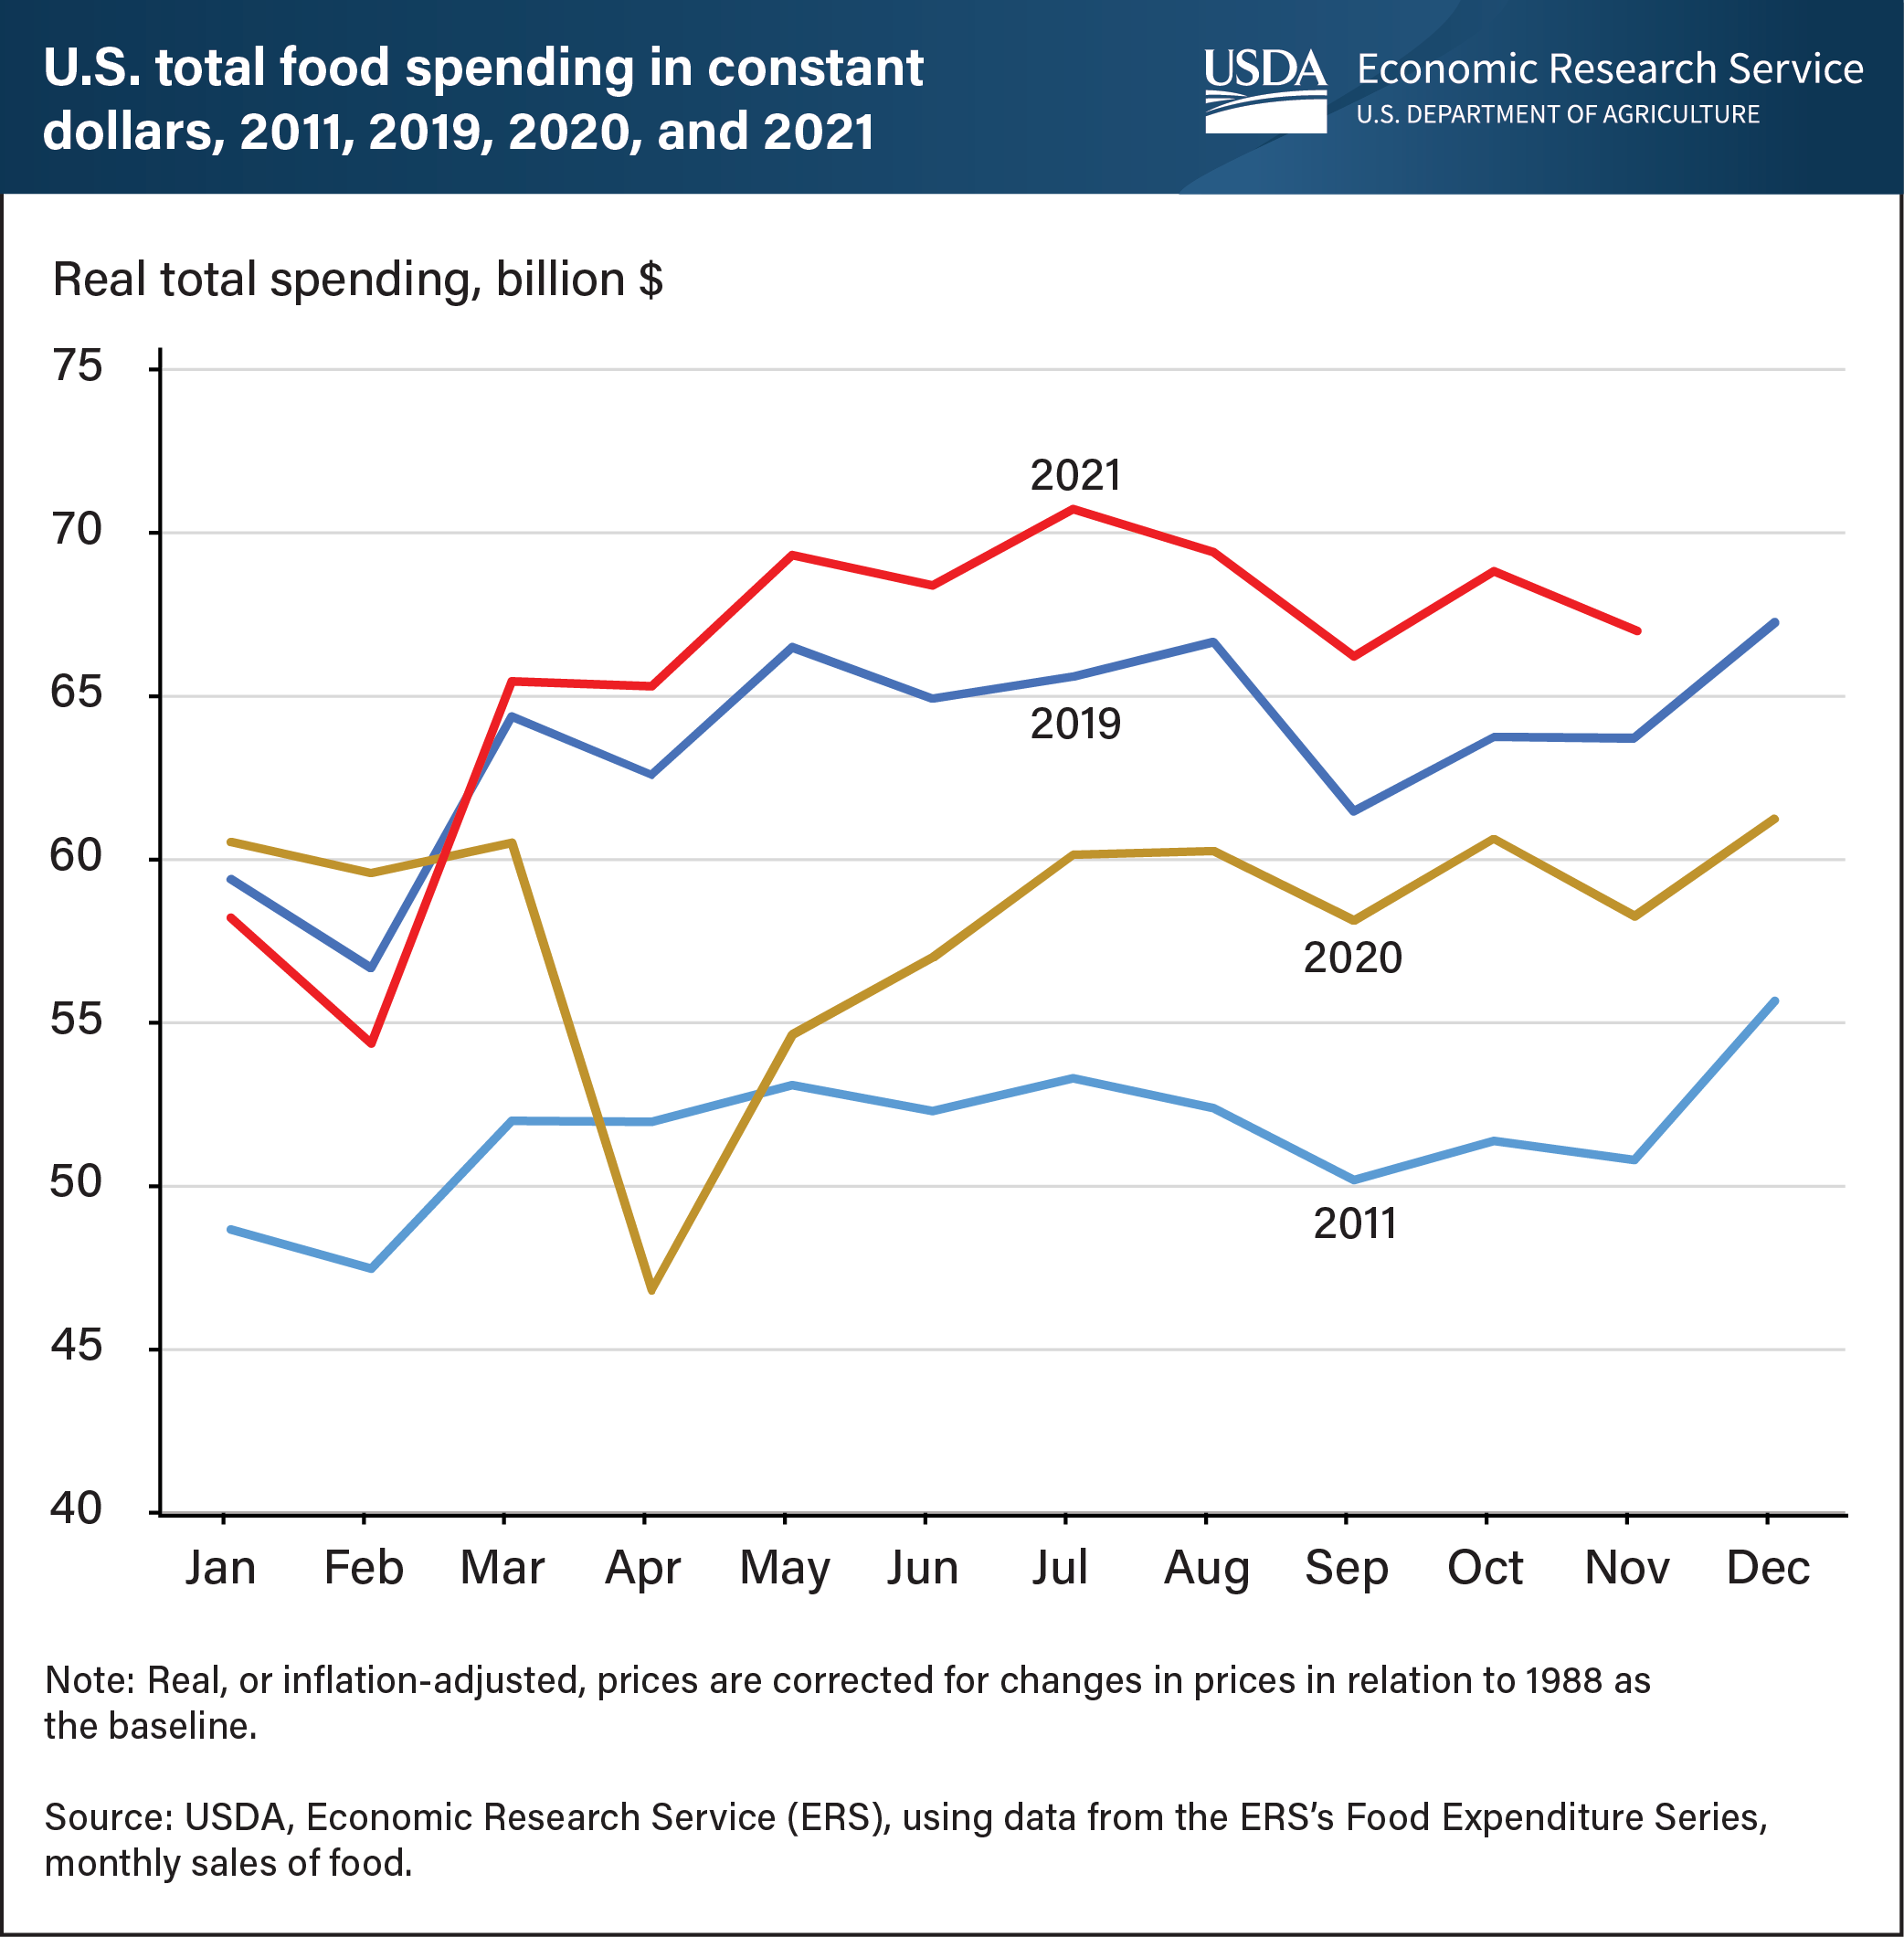
Total food spending in the United States generally follows seasonal trends. The lowest food spending levels usually occur in January and February, before rising in March and remaining at this higher level through August. Spending then drops from September through November before peaking during the December holidays. However, food economy disruptions following the onset of the Coronavirus (COVID-19) pandemic in early 2020 altered historical monthly food spending trends in the United States. The USDA, Economic Research Service’s (ERS) Food Expenditure Series tracks food spending beginning in 1997. The largest monthly decline in food spending (23 percent) occurred in April 2020, and monthly food spending averaged 8.3 percent lower in 2020 than in 2019. Overall, total U.S. food spending has consistently increased over the years, even when accounting for inflation. Average inflation-adjusted monthly expenditures were 23.2 percent higher in 2019 than in 2011. Though total food spending in 2021 has followed the typical pattern, spending began the year below pre-pandemic levels but surpassed previous years beginning in March. The data for this chart come from the ERS’s Food Expenditure Series data product.