

Per acre water use in irrigated farmland shows a declining trend
- by R. Aaron Hrozencik
- 1/19/2022
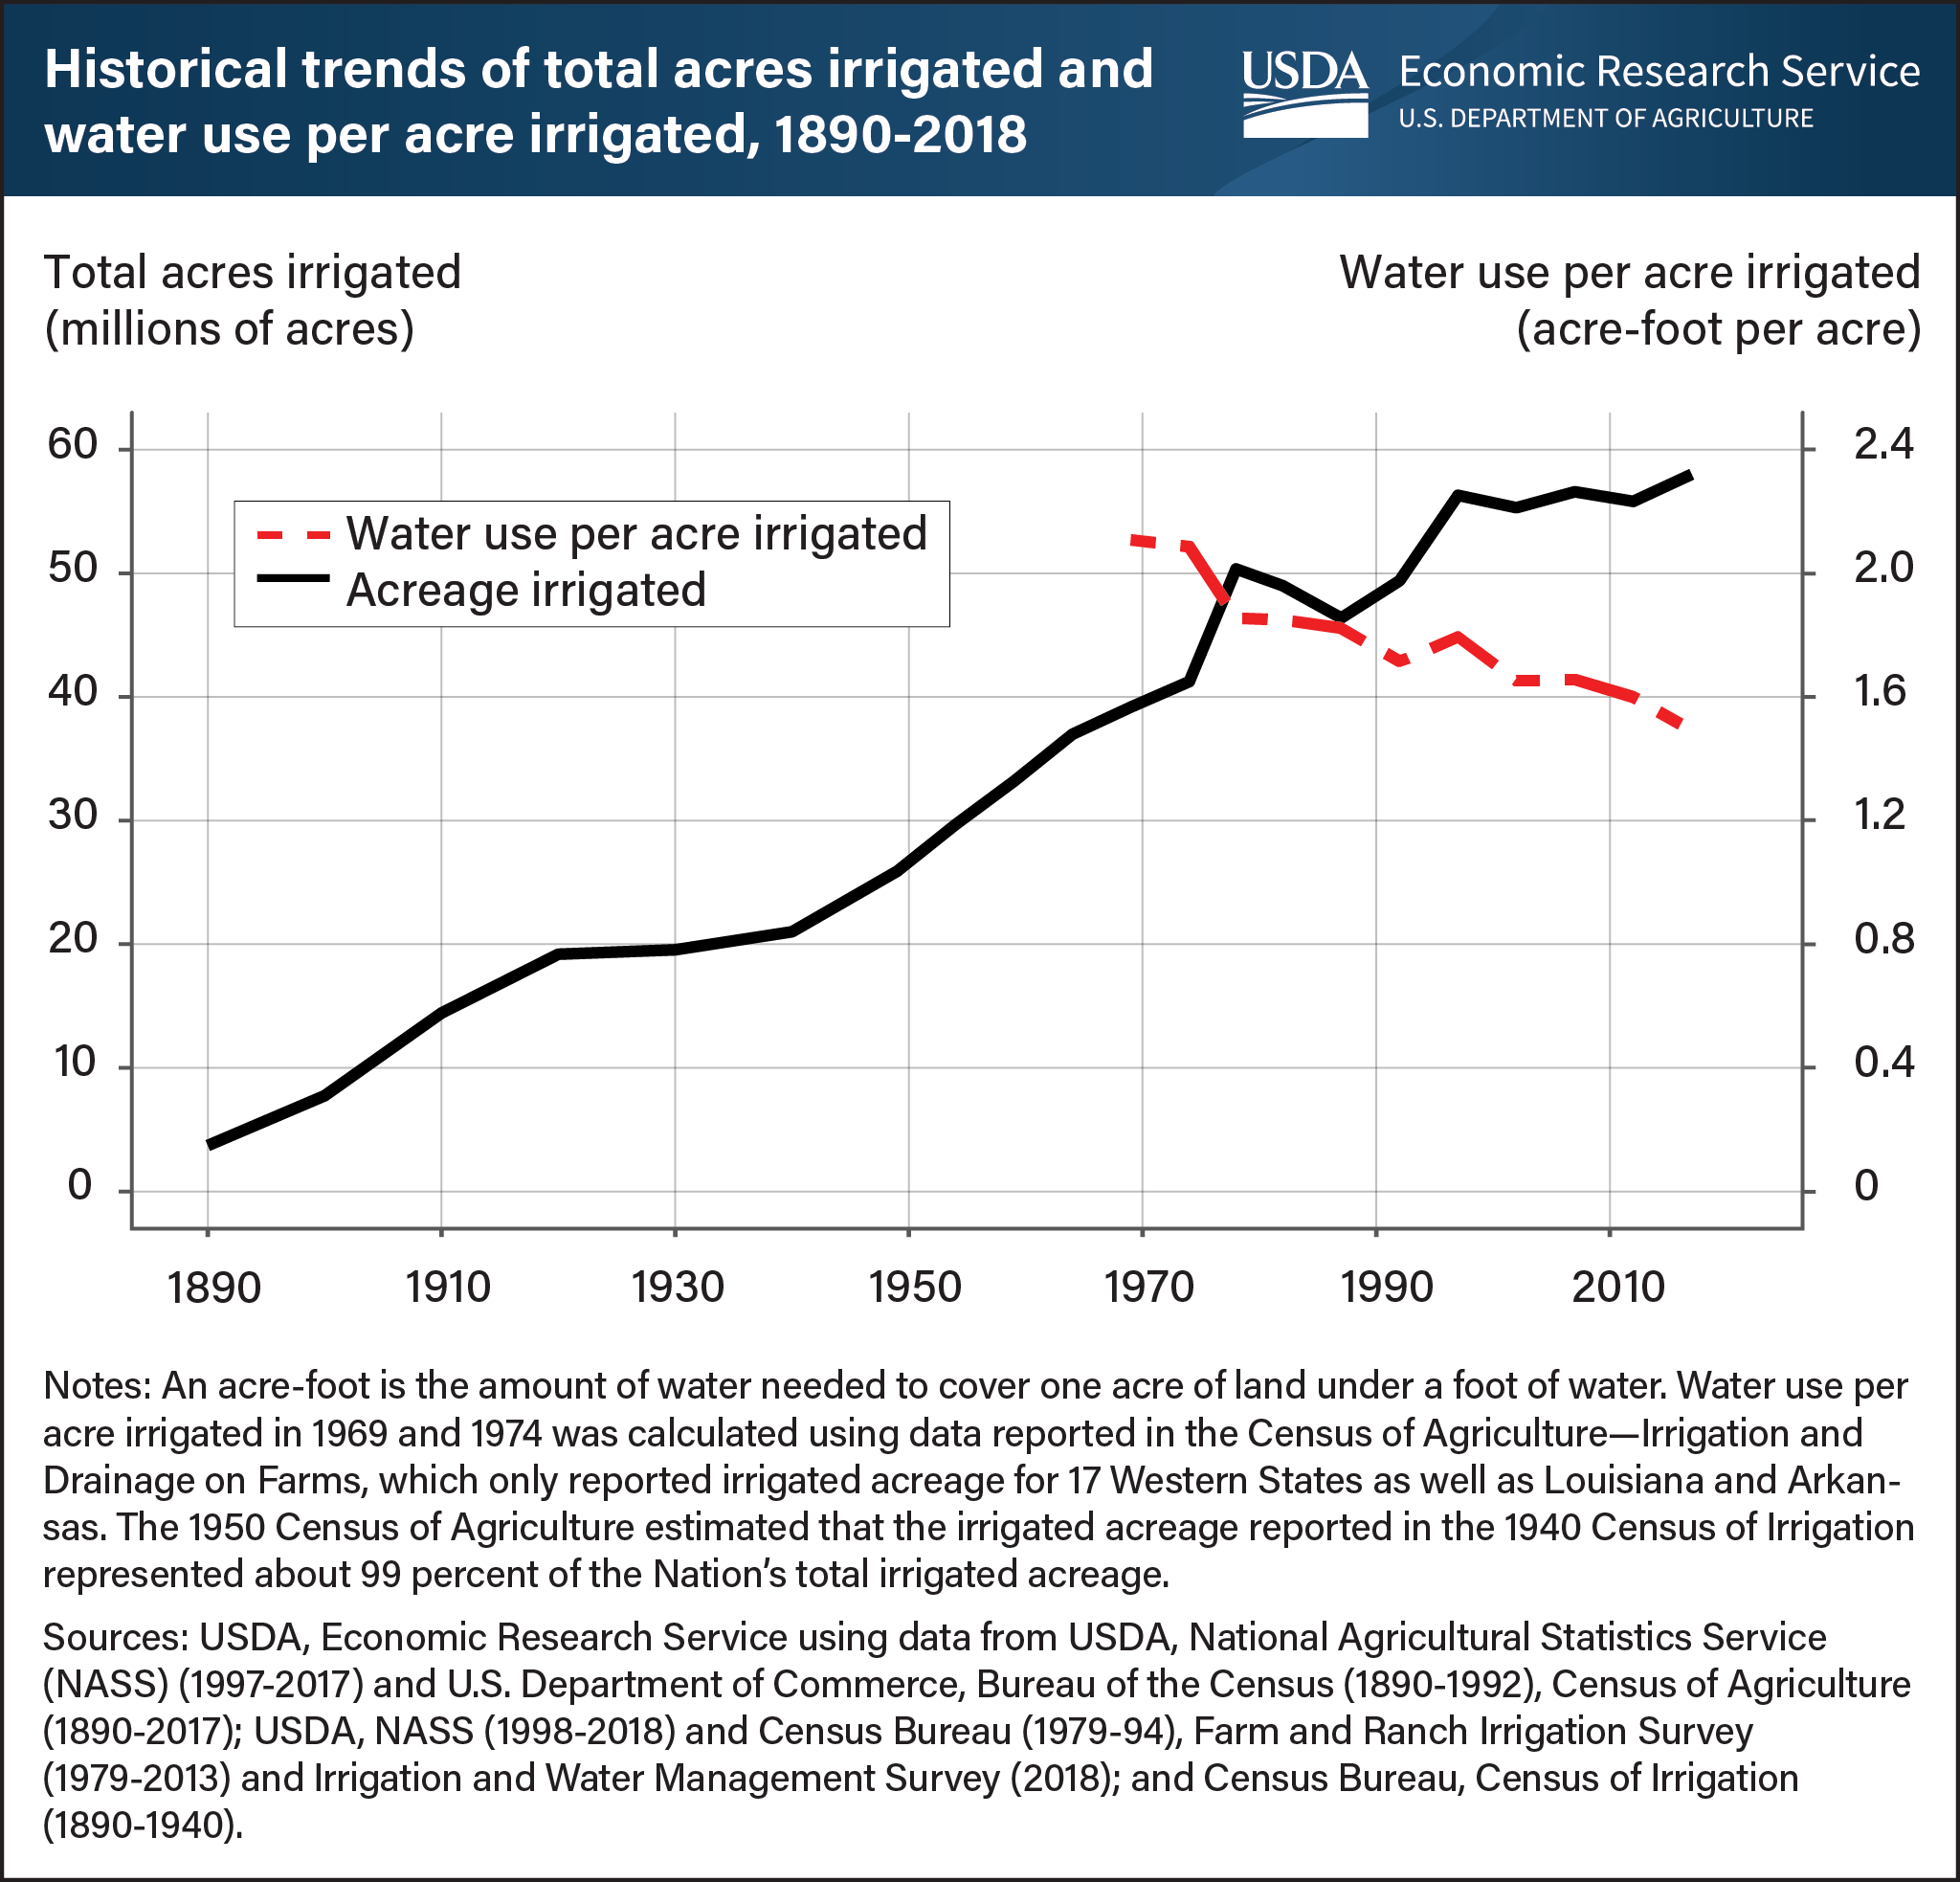
The importance of irrigation for the U.S. agricultural sector has evolved significantly over the past century. Irrigated acreage in the country has grown from fewer than 3 million acres in 1890 to more than 58 million acres in 2017. The expansion of irrigated acreage during this period reflects Federal, State, and local investment in irrigation infrastructure to deliver surface water to farms and ranches. Additionally, this expansion is partly due to advancements in well drilling and pumping technologies, which have facilitated growth in groundwater-based irrigated agriculture. Since 1969, the amount of water used per acre irrigated has decreased substantially. The average water use per acre irrigated was more than 2 acre-feet (1 acre-foot = 325,851 gallons) in 1969, which declined to nearly 1.5 acre-feet by 2018. Efficient water application technologies, such as the transition from gravity-based to pressurized irrigation systems, have driven the reduction in water use per acre of irrigated land. This chart was drawn from the USDA, Economic Research Service report “Trends in U.S. Irrigated Agriculture: Increasing Resilience Under Water Supply Scarcity,” published December 2021.