
Employment in U.S. agriculture grew 9 percent between 2010 and 2020
- by Marcelo Castillo
- 9/3/2021
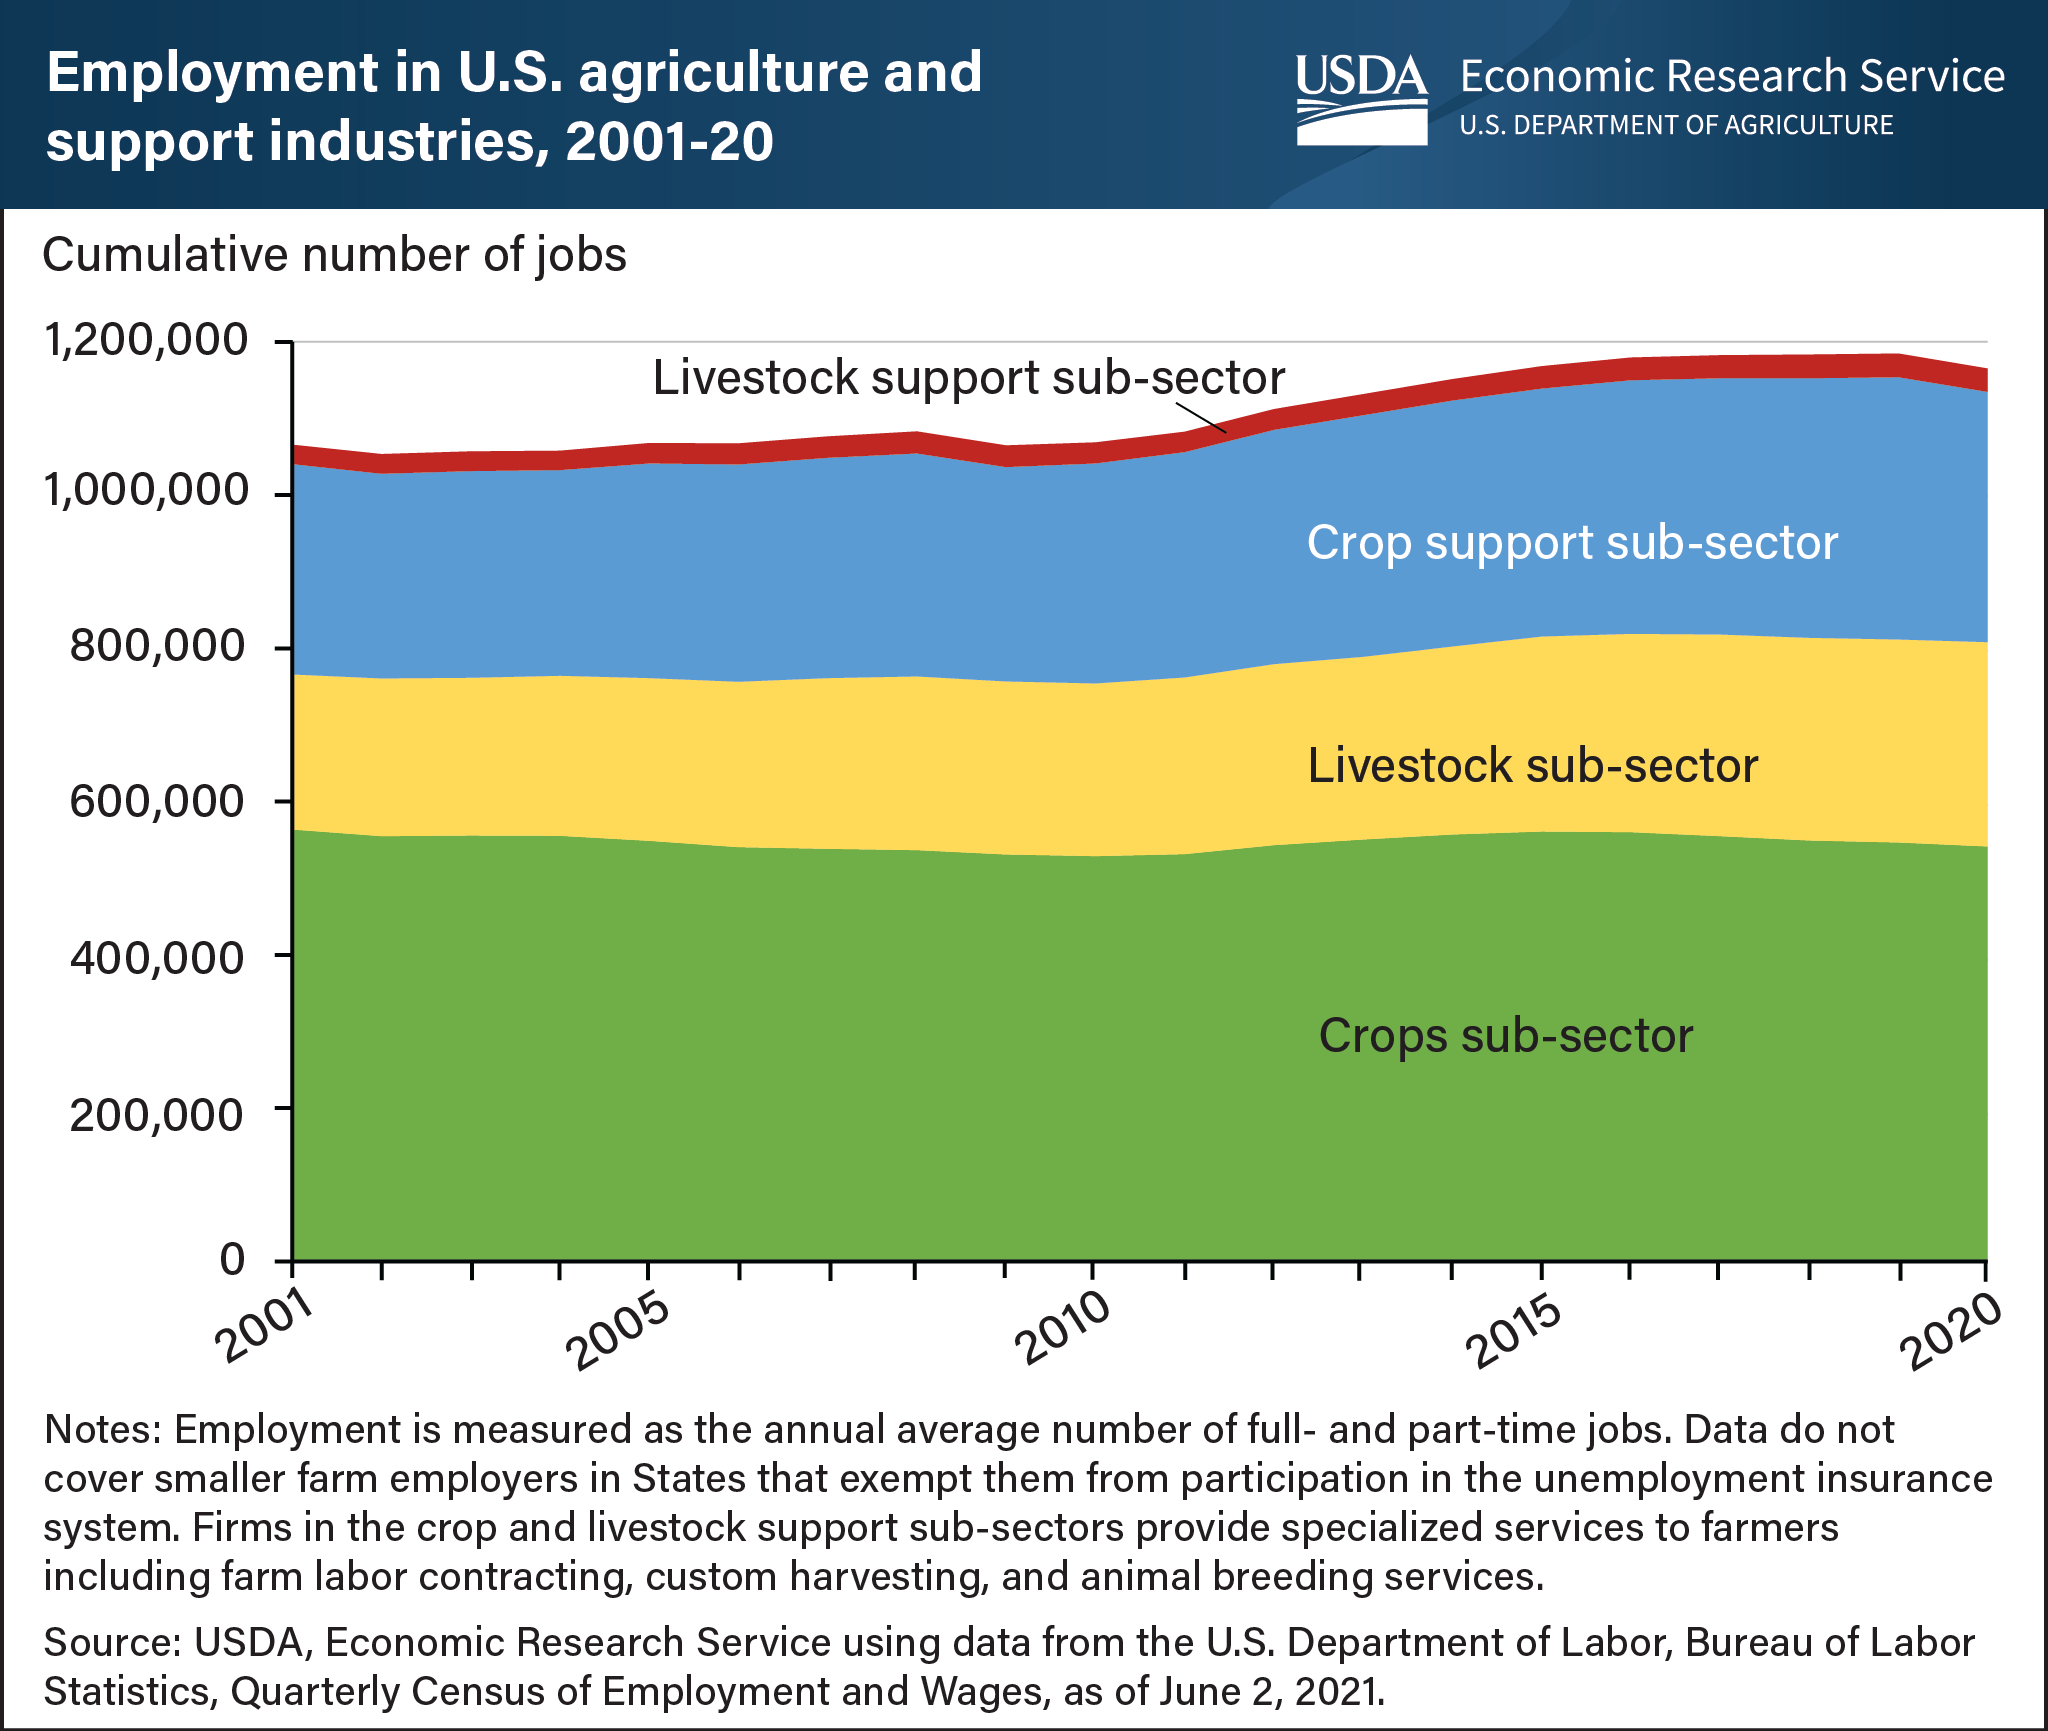
Data from the U.S. Bureau of Labor Statistics’ Quarterly Census of Employment and Wages (QCEW) show that wage and salary employment in agriculture was stable in the 2000s. Starting in 2010, it gradually increased from 1.07 million jobs to 1.17 million jobs in 2020—a gain of 9 percent. From 2010-20, growth was fastest in the livestock sub-sector, which added 41,300 jobs, an 18 percent increase, and in crop support services, which added 38,000 jobs, a 13 percent increase. Firms in the crop and livestock support sub-sectors provide specialized services to farmers including farm labor contracting, custom harvesting, and animal breeding services. By comparison, employment of direct hires in the crop sub-sector, which has the largest number of hired farm workers, remained essentially unchanged. Data from QCEW is based on unemployment insurance records, not on surveys of farms or households. As a result, it does not cover smaller farm employers in States that exempt such employers from participation in the unemployment insurance system. However, survey data from sources such as the American Community Survey and the Current Population Survey also showed rising farm employment since the turn of the century. This chart appears in the Economic Research Service topic page for Farm Labor, updated August 2021.
We’d welcome your feedback!
Would you be willing to answer a few quick questions about your experience?