
Share of off-farm income varies by commodity specialization
- by Tia M. McDonald, Dipak Subedi and Anil K. Giri
- 4/26/2021
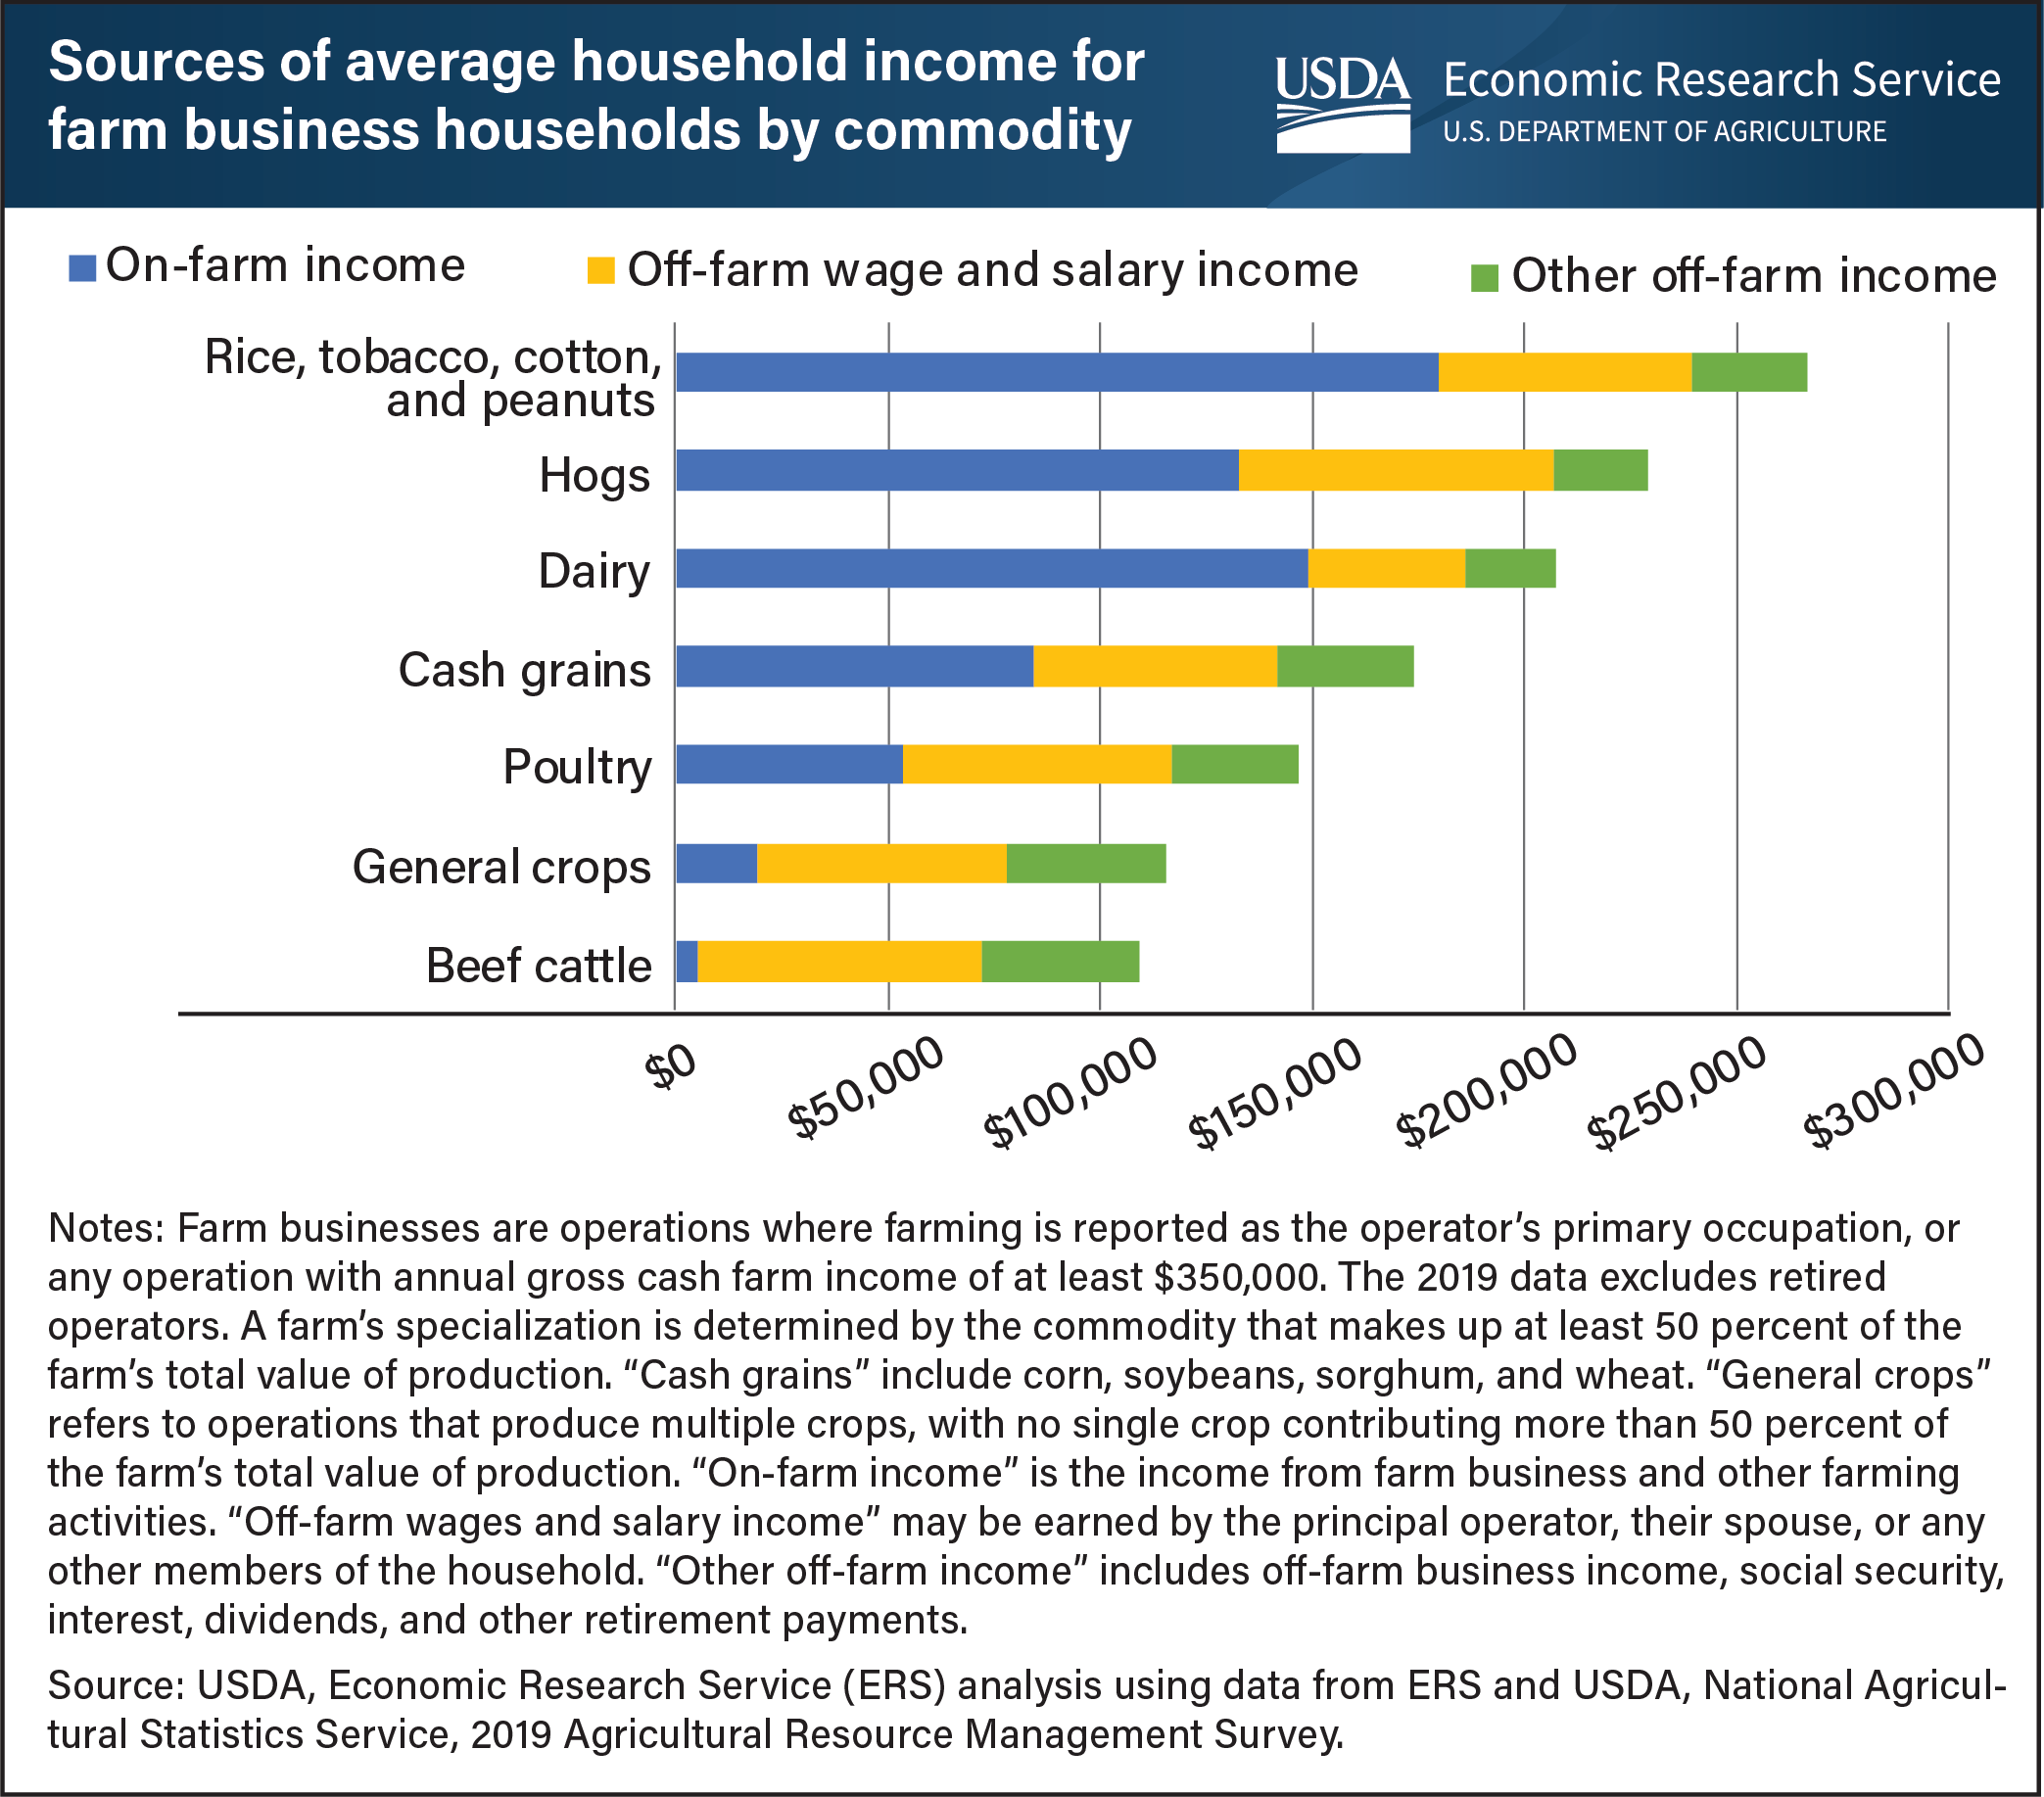
Farm households obtain income from farming and off-farm income, such as salaries, pensions, and investment interest. Among farm businesses, off-farm wage and salary income varied by commodity specialization. For general crops, beef cattle, and poultry operations, average off-farm wage and salary income contributed more than half of total household income. Dairy operations, by comparison, averaged $37,339 in off-farm wage and salary income, the lowest of any commodity. Dairy operations require extensive and ongoing time commitments, so managing a dairy farm rarely permits an operator to work many hours off-farm. As a result, dairy farm households relied primarily on income from the operation, an average of $148,831 in 2019. This chart is based on data from the ERS data product ARMS Farm Financial and Crop Production Practices, updated December 2020.
We’d welcome your feedback!
Would you be willing to answer a few quick questions about your experience?