
Share of food-at-home spending in the United States returned to Great Recession levels in 2020
- by Wilson Sinclair and Eliana Zeballos
- 3/24/2021
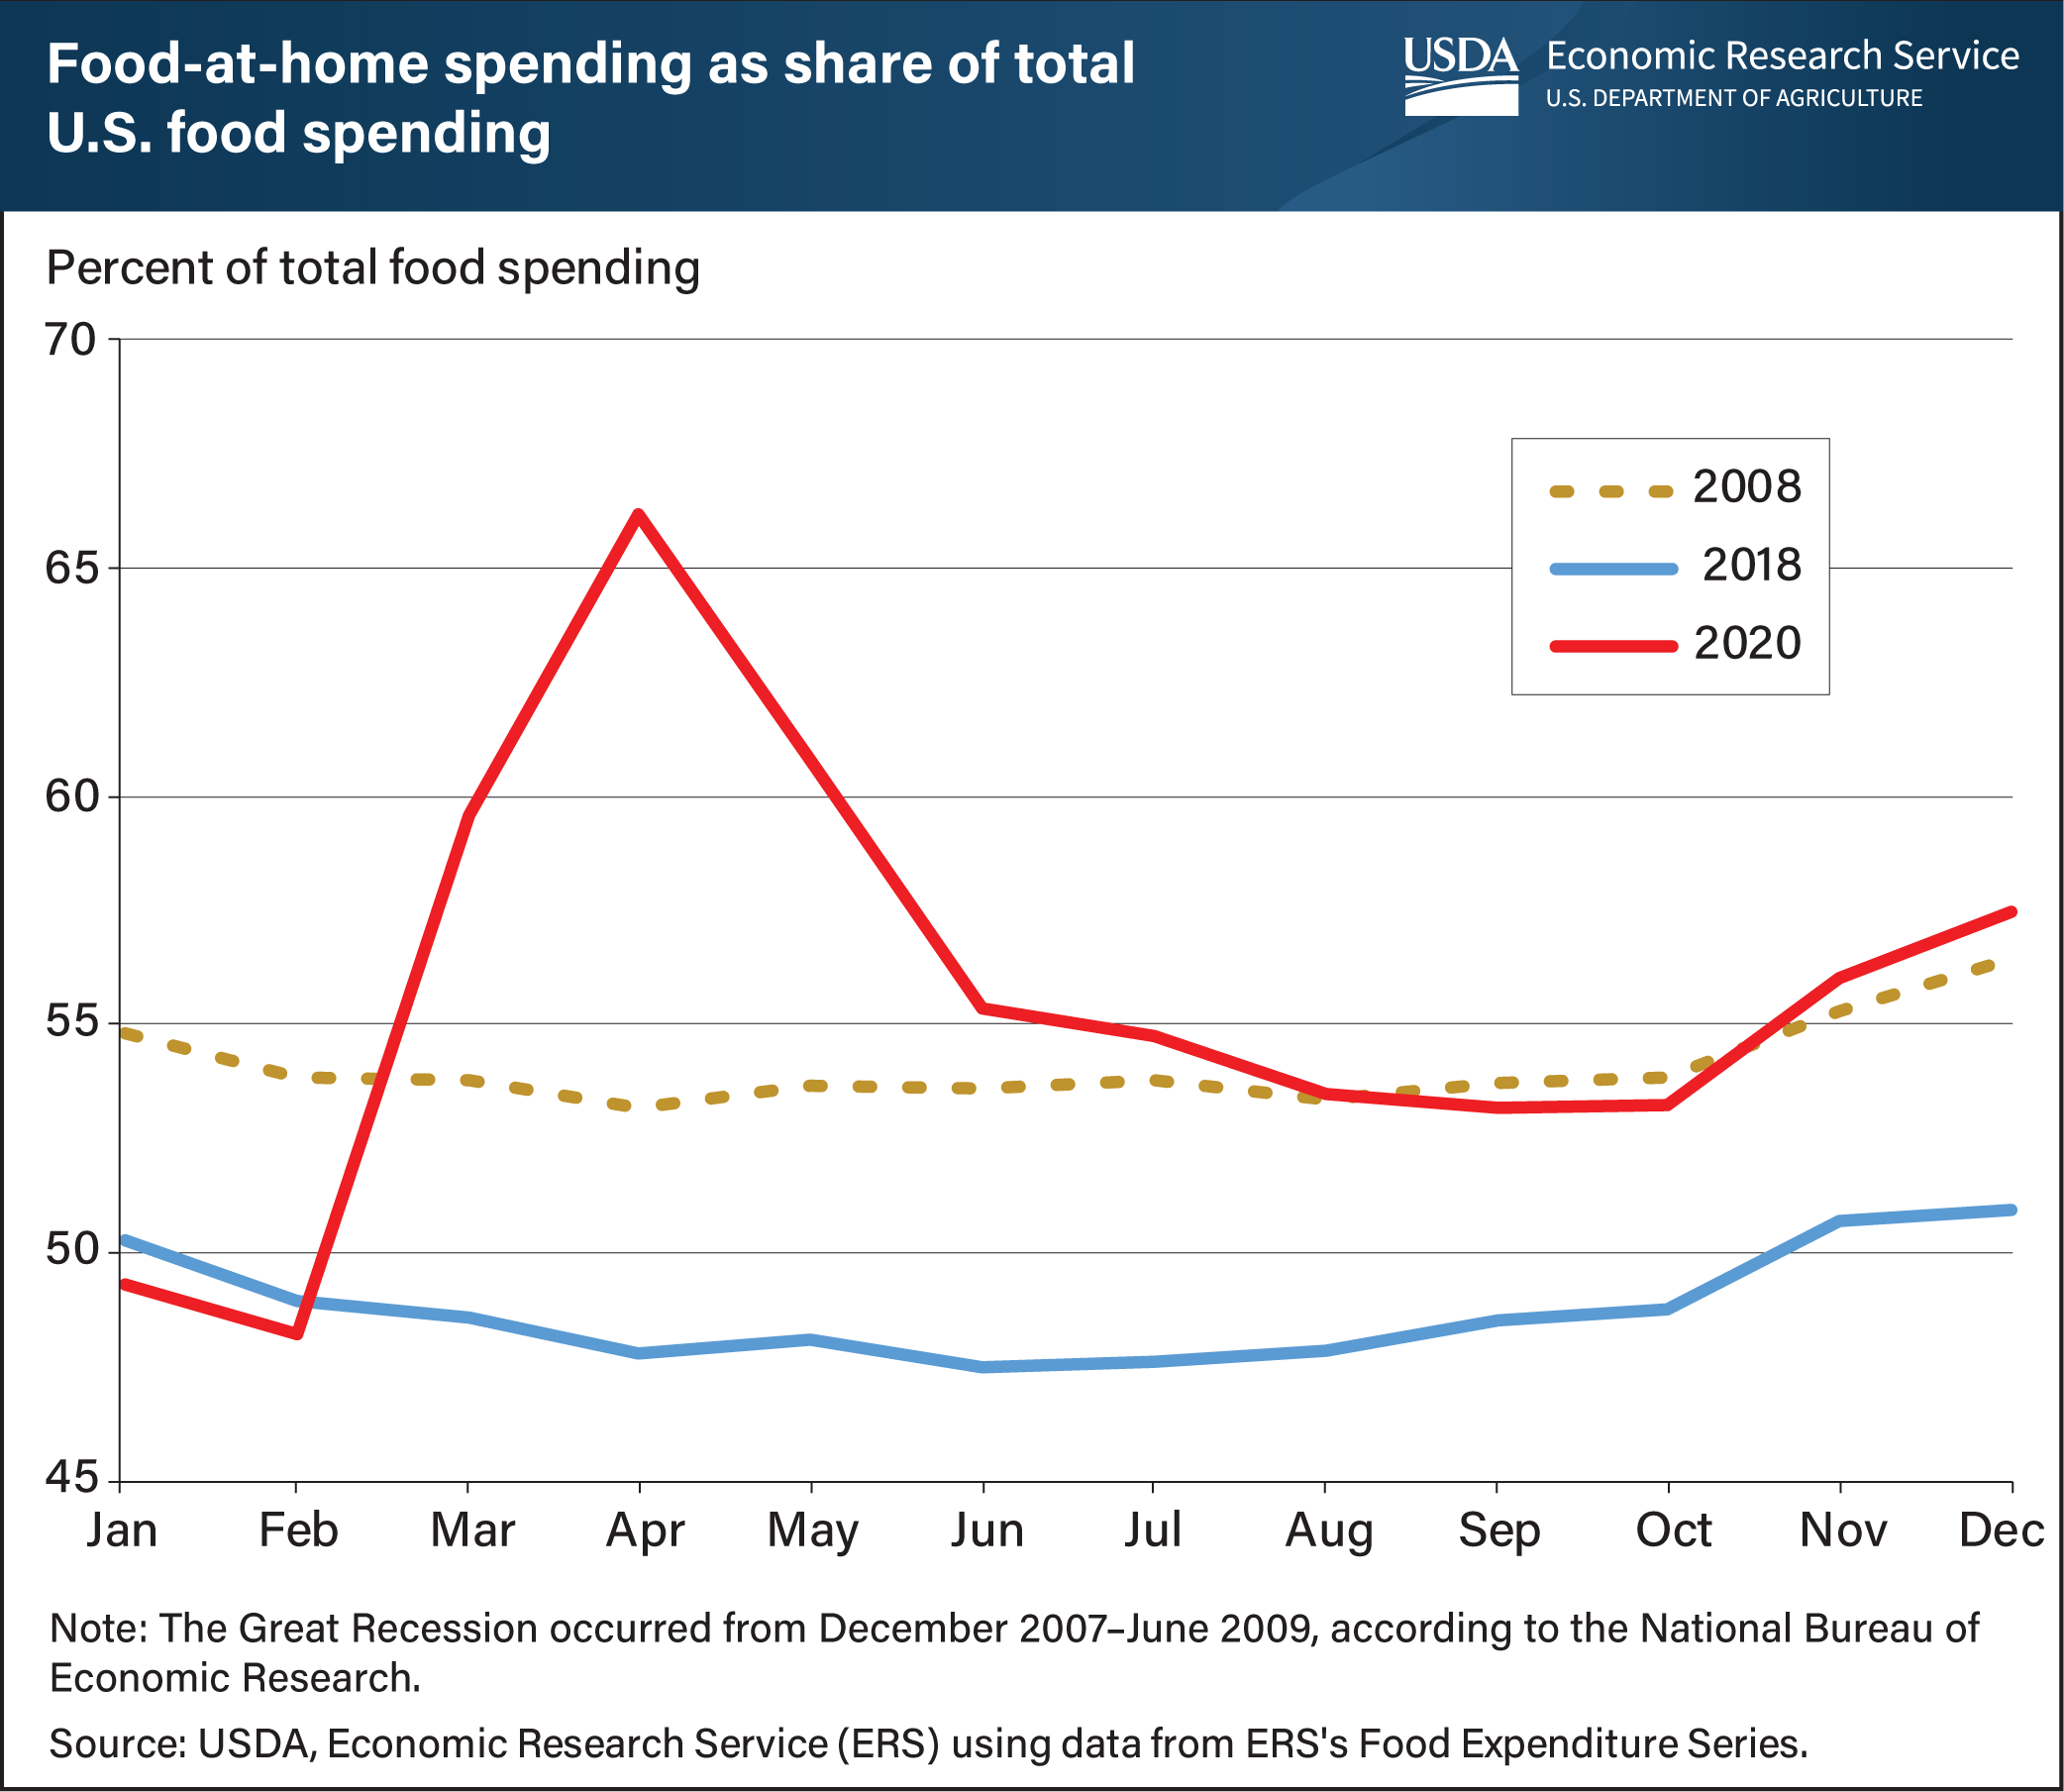
The share of food dollars spent at grocers, supercenters, and other food-at-home (FAH) retailers in the United States rose in 2020 above Great Recession levels in 2008 as the COVID-19 pandemic disrupted the way people consumed food. The share of spending at FAH establishments began a sharp climb from 48 percent in February 2020, and by April 2020, 66 percent of food spending was devoted to at-home consumption. Shifts to greater FAH spending occurred as states issued stay-at-home mandates and people generally avoided public gatherings. The economic recession likely exacerbated this shift as FAH purchases are more cost-efficient. Even after its April 2020 peak, the share of FAH spending reached the same level in August 2020 as it was in August 2008, during the Great Recession. After that, food spending shares generally followed typical seasonal patterns, although at a level more like the Great Recession than 2018, remaining stable with a slight increase in FAH spending in the colder, winter months. ERS researchers will continue to examine food expenditure data to determine whether this change will endure beyond the pandemic and recession. The data for this chart come from the USDA, Economic Research Service’s Food Expenditure Series data product.