

U.S. irrigation organizations performed a variety of water management functions
- by Steven Wallander, R. Aaron Hrozencik and Marcel Aillery
- 1/15/2021
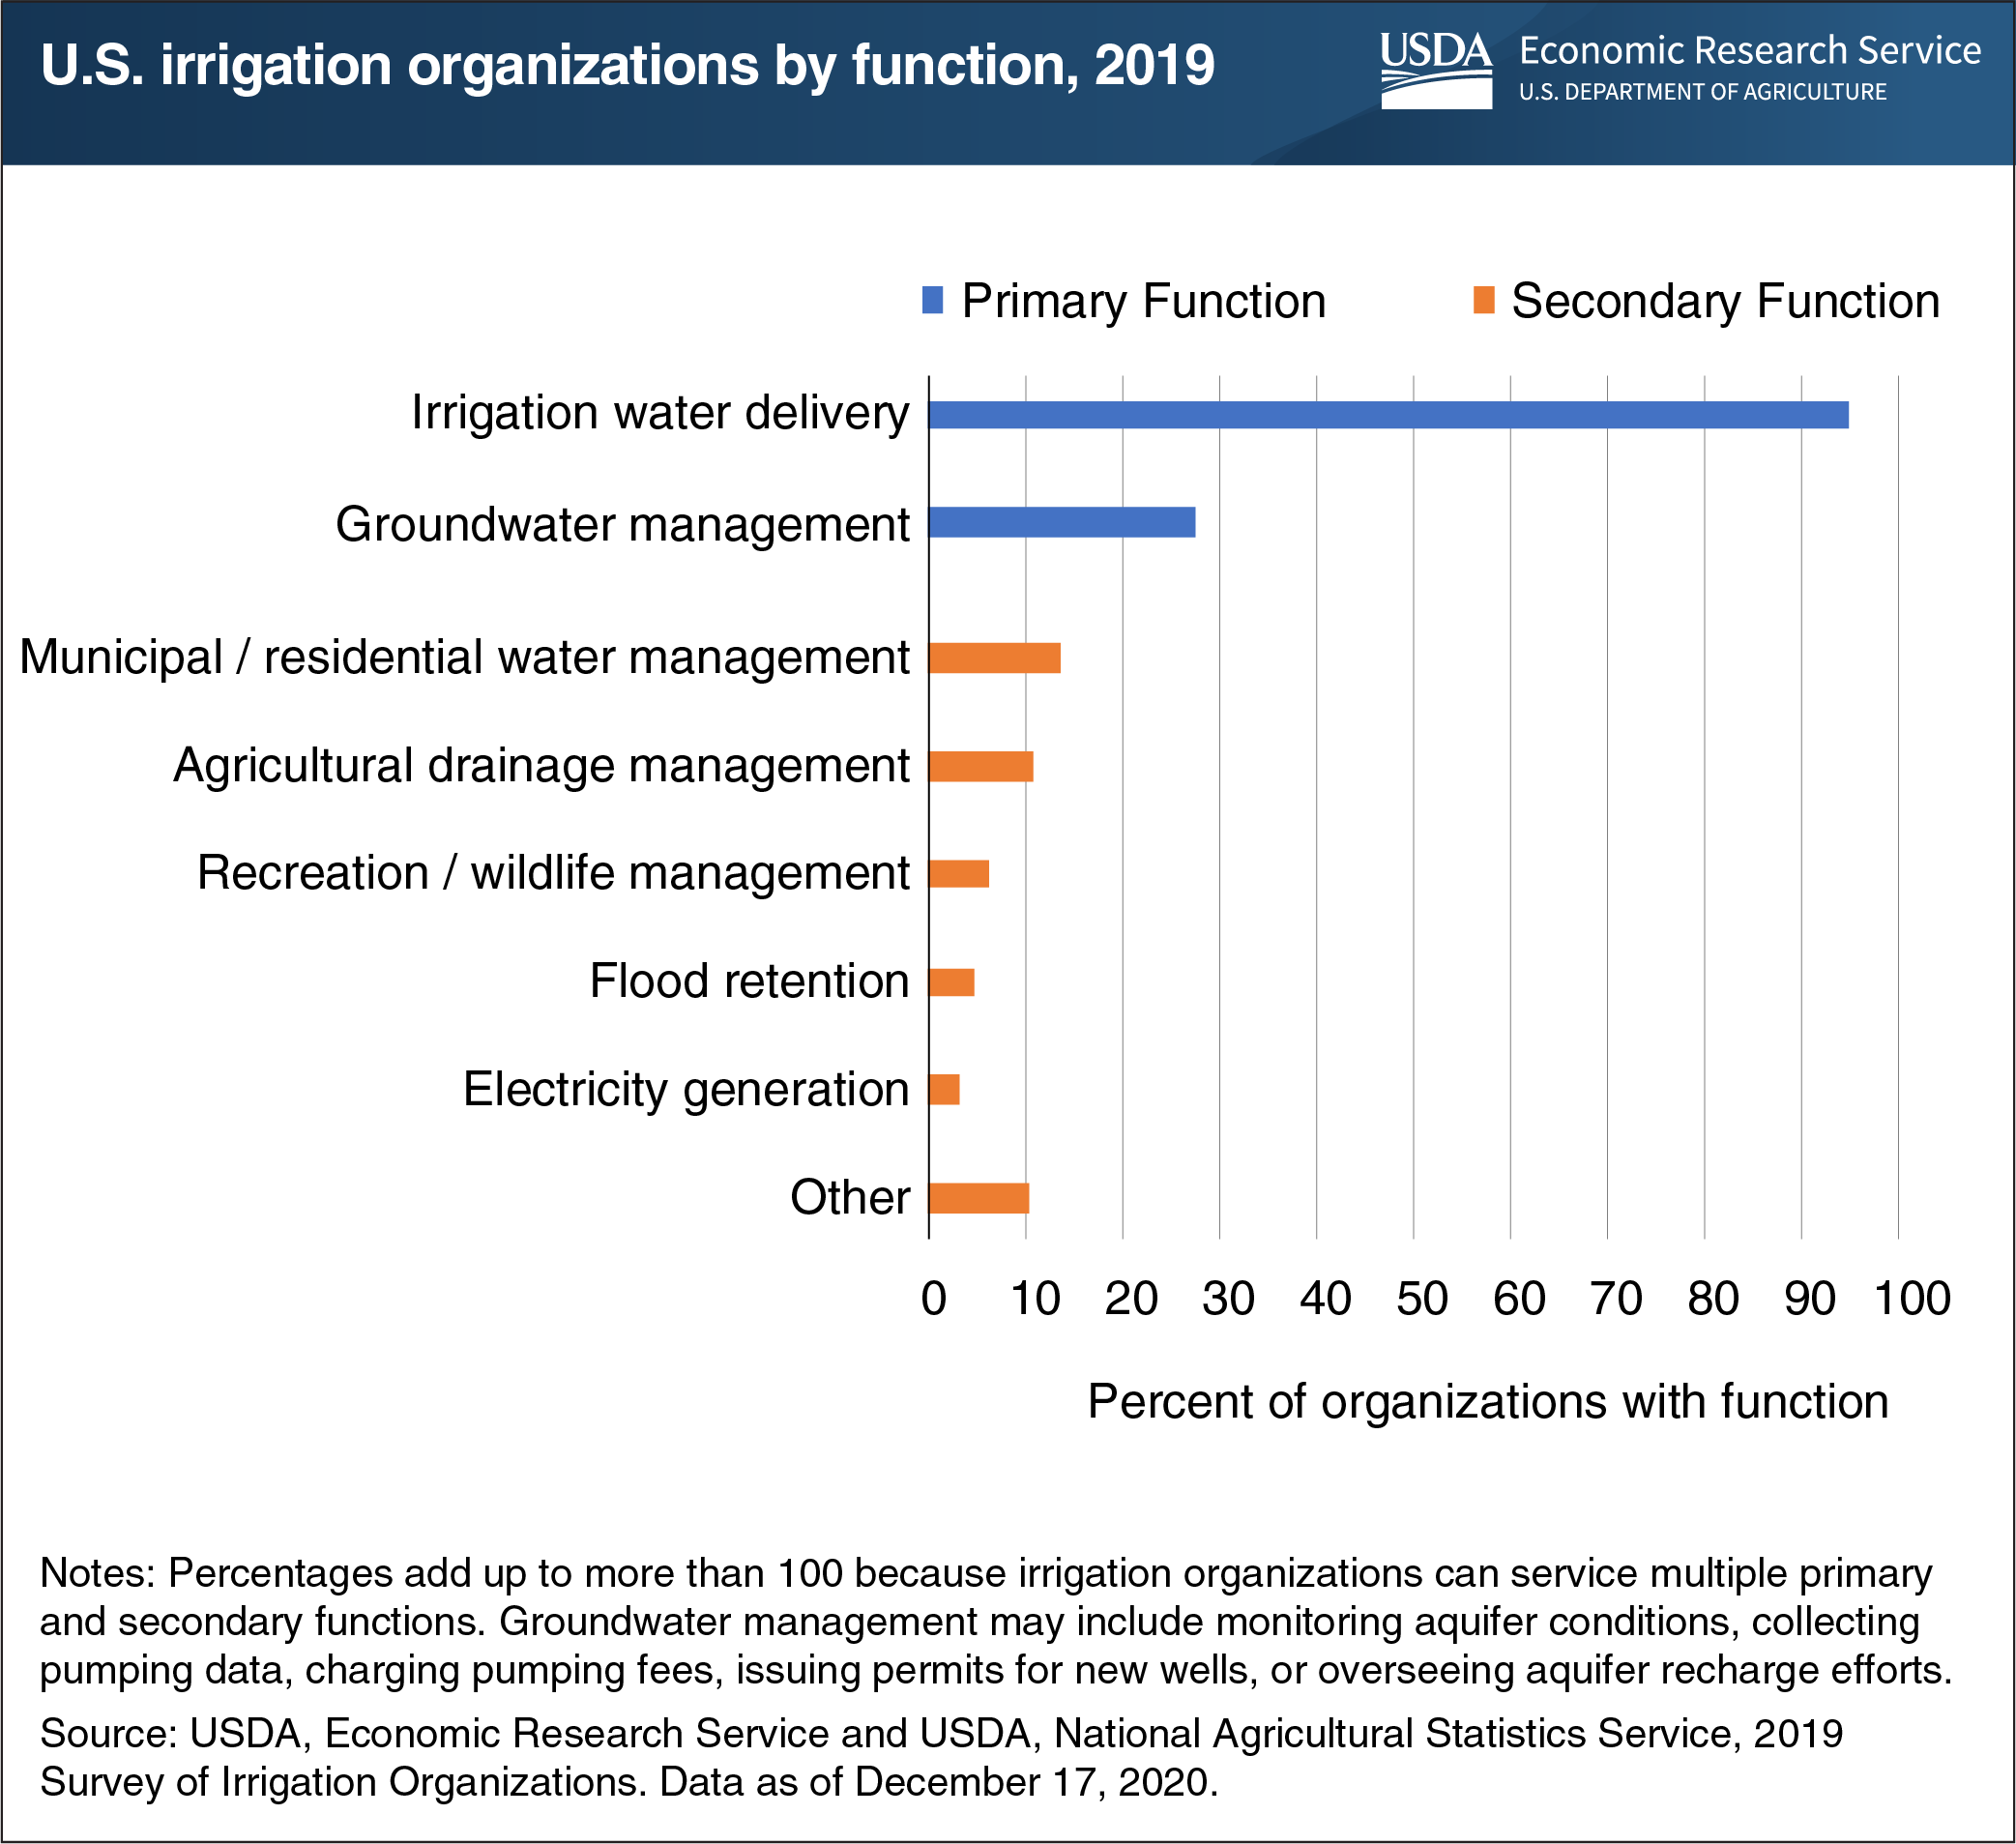
The 2019 Survey of Irrigation Organizations (SIO), jointly conducted by USDA’s Economic Research Service and National Agricultural Statistics Service, collected information about different types of organizations involved in the local management of water supplies for irrigated farms and ranches. Irrigation organizations directly influence on-farm water use through delivery of irrigation supplies and management of groundwater withdrawals. According to the survey’s data, in 2019, there were an estimated 2,677 irrigation organizations in the 24 States where most U.S. irrigation occurred. About 95 percent of these organizations—such as irrigation districts and ditch companies—had a primary function of delivering water directly to farms, typically through a system of irrigation storage facilities, canals, pipelines, acequias, and ditches. About 27 percent of organizations were involved in at least some aspect of groundwater management as a primary function, with 23 percent of organizations engaging in both water delivery and groundwater management. Groundwater management may include monitoring aquifer conditions, collecting pumping data, charging pumping fees, issuing permits for new wells, or overseeing aquifer recharge efforts. Some irrigation organizations perform secondary functions, such as delivering water to municipal and residential users (14 percent of organizations); managing agricultural water drainage (11 percent); and generating electricity (3 percent). This chart is based on data found in USDA’s Survey of Irrigation Organizations, updated December 17, 2020.