



Land in rural parks, wildlife reserves, and wilderness areas has been increasing
- by Scott Callahan
- 10/28/2026
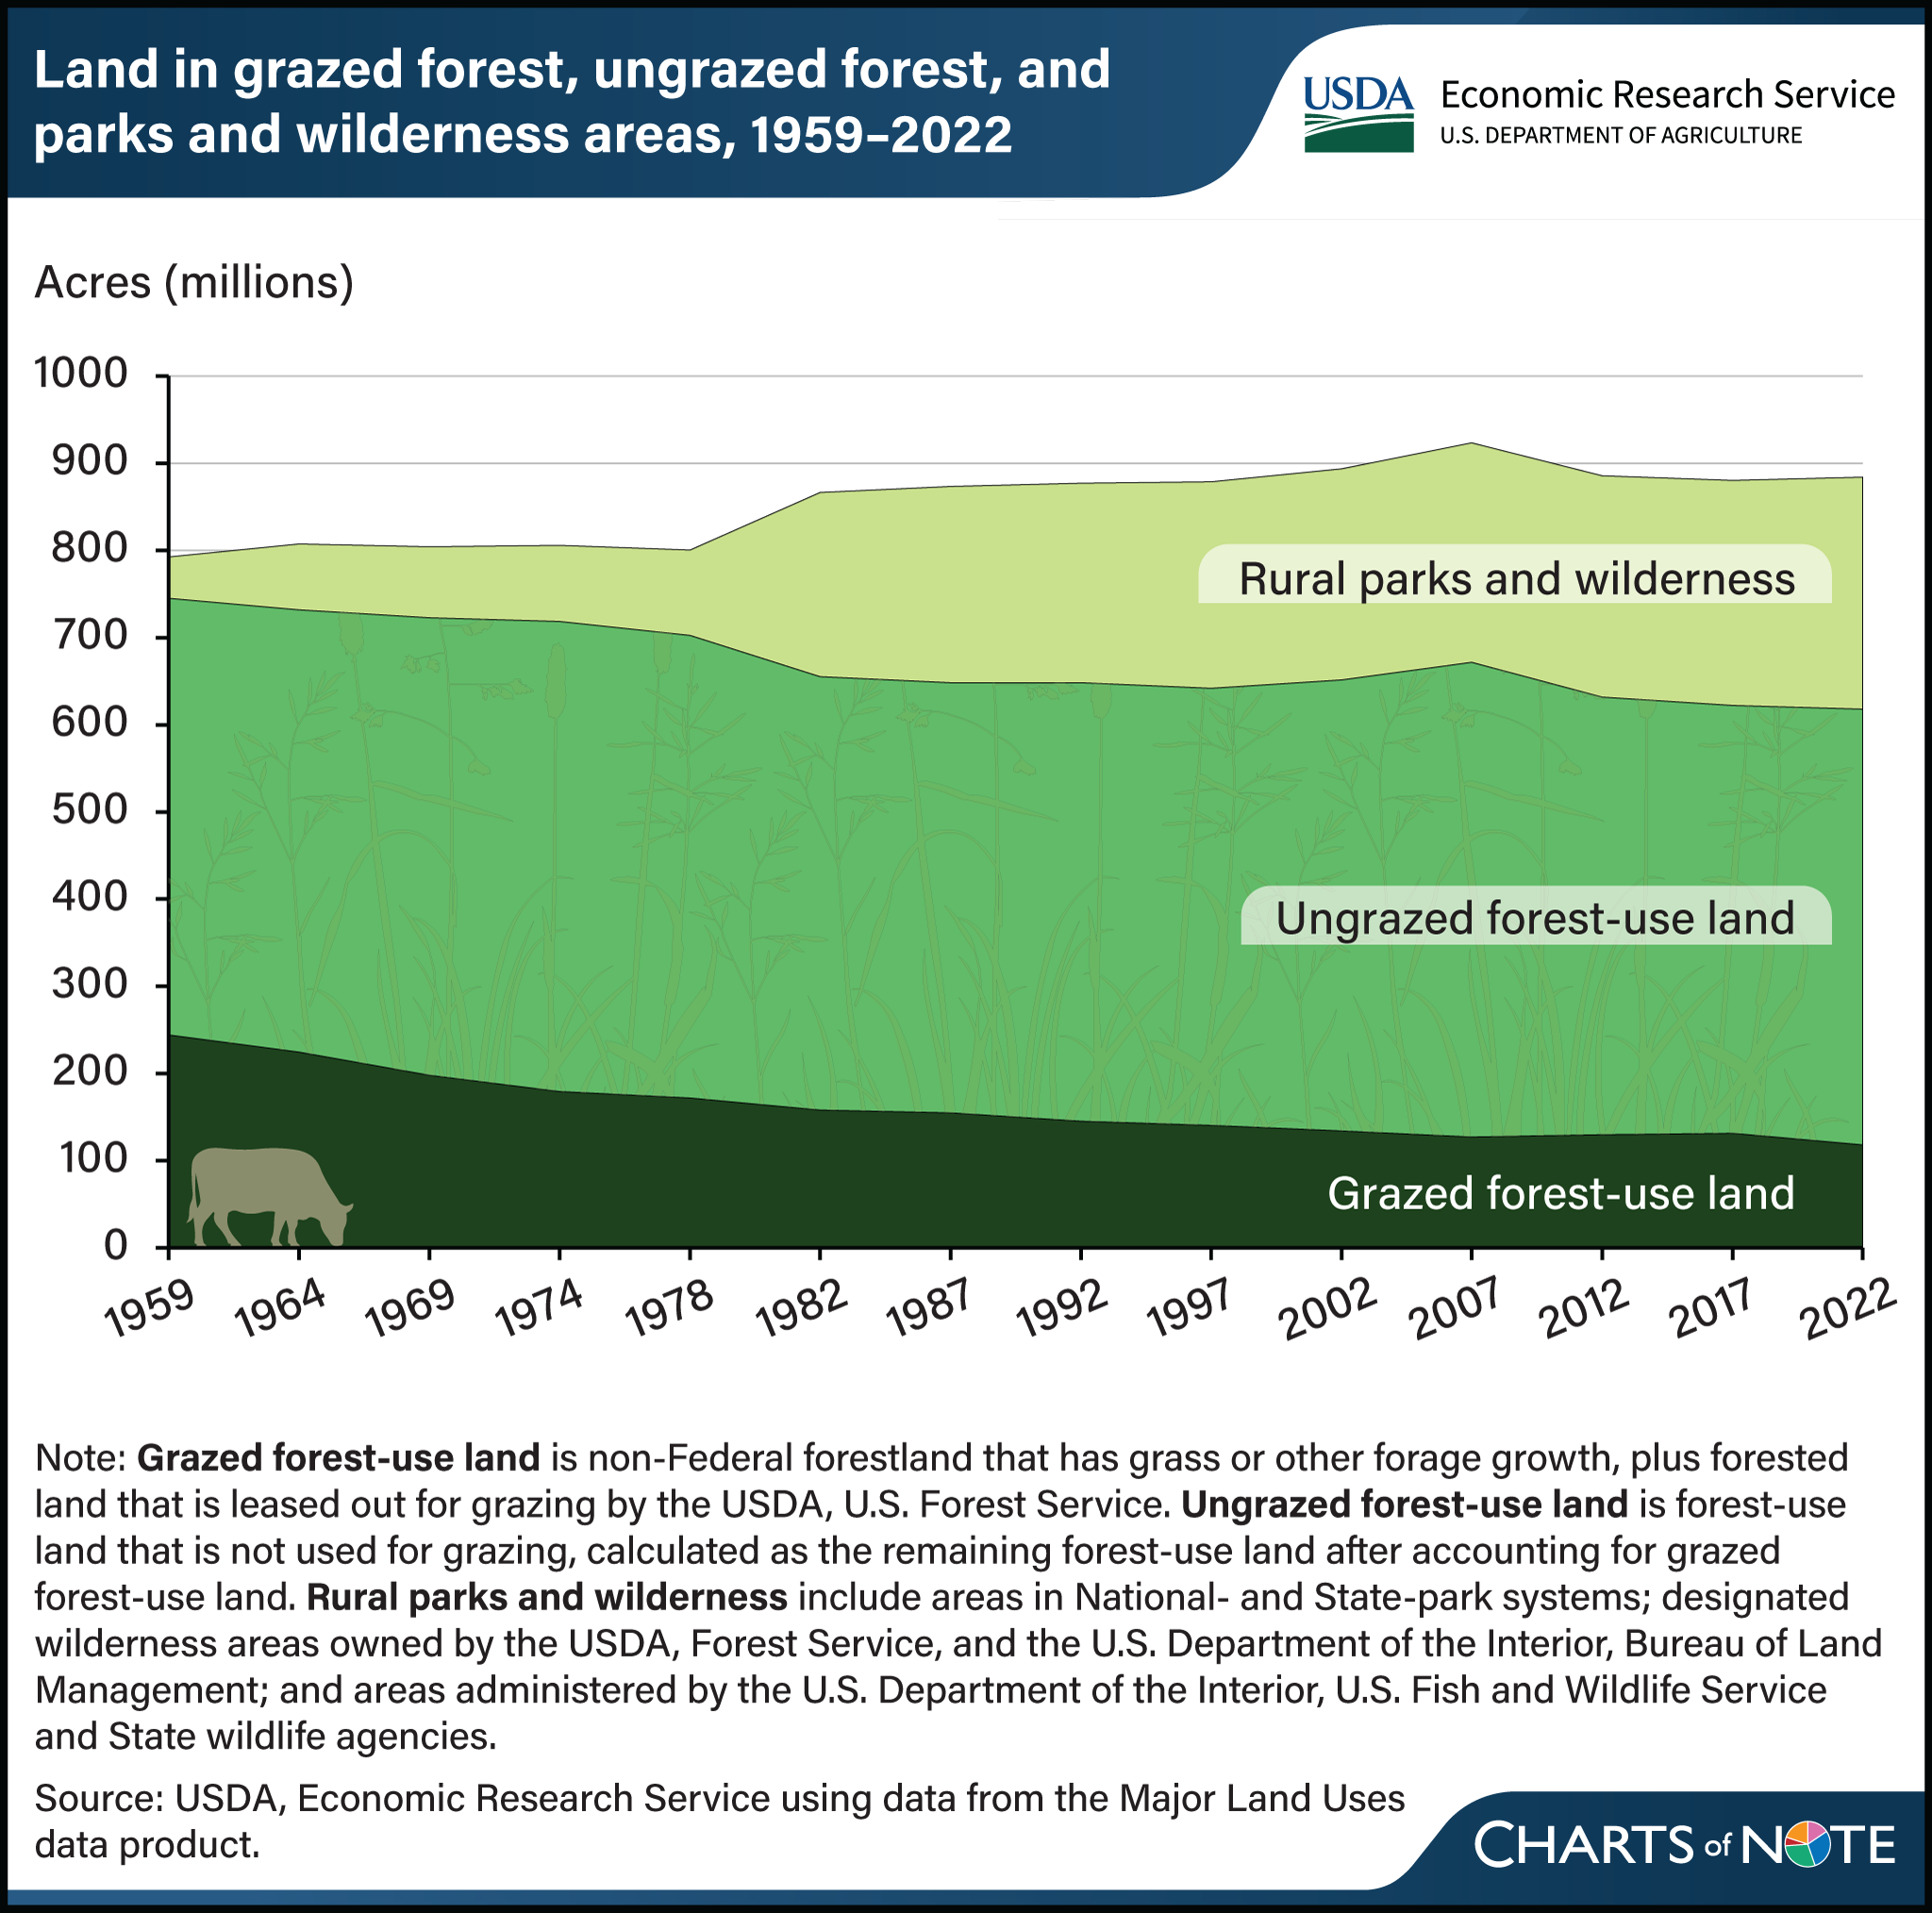
Forestland, including grazed forestland, ungrazed forestland, and rural parks and wilderness areas, has increased over the last 60 years. Since 1959, grazed forest‑use land—non‑Federal forest with forage or forest leased for grazing—declined by roughly half, from the late 1950s level of 245 million acres to 118 million acres in 2022. In contrast, acres in rural parks, wildlife reserves, and wilderness have grown steadily, reflecting additions to Federal and State protected systems and other conservation designations. Ungrazed forest‑use land remained stable, with some modest fluctuations tied to how timberland is classified rather than broad land‑cover change. These trends indicate that more forested acres are managed primarily for recreation, habitat, and preservation, while fewer are used for livestock grazing. In 2022, grassland pasture and range remained the largest single land‑use category nationally, but protected lands accounted for an increasing share of “special uses” land, a category that also includes land dedicated to rural transportation (e.g., roads and airports), farmsteads, and national defense and industrial areas. This chart is drawn from USDA, Economic Research Service’s Major Land Uses, updated August 2026.
We’d welcome your feedback!
Would you be willing to answer a few quick questions about your experience?