




U.S. food system required greater share of national water use compared to employment or energy use
- by Sarah Rehkamp and Wilson Sinclair
- 9/30/2026
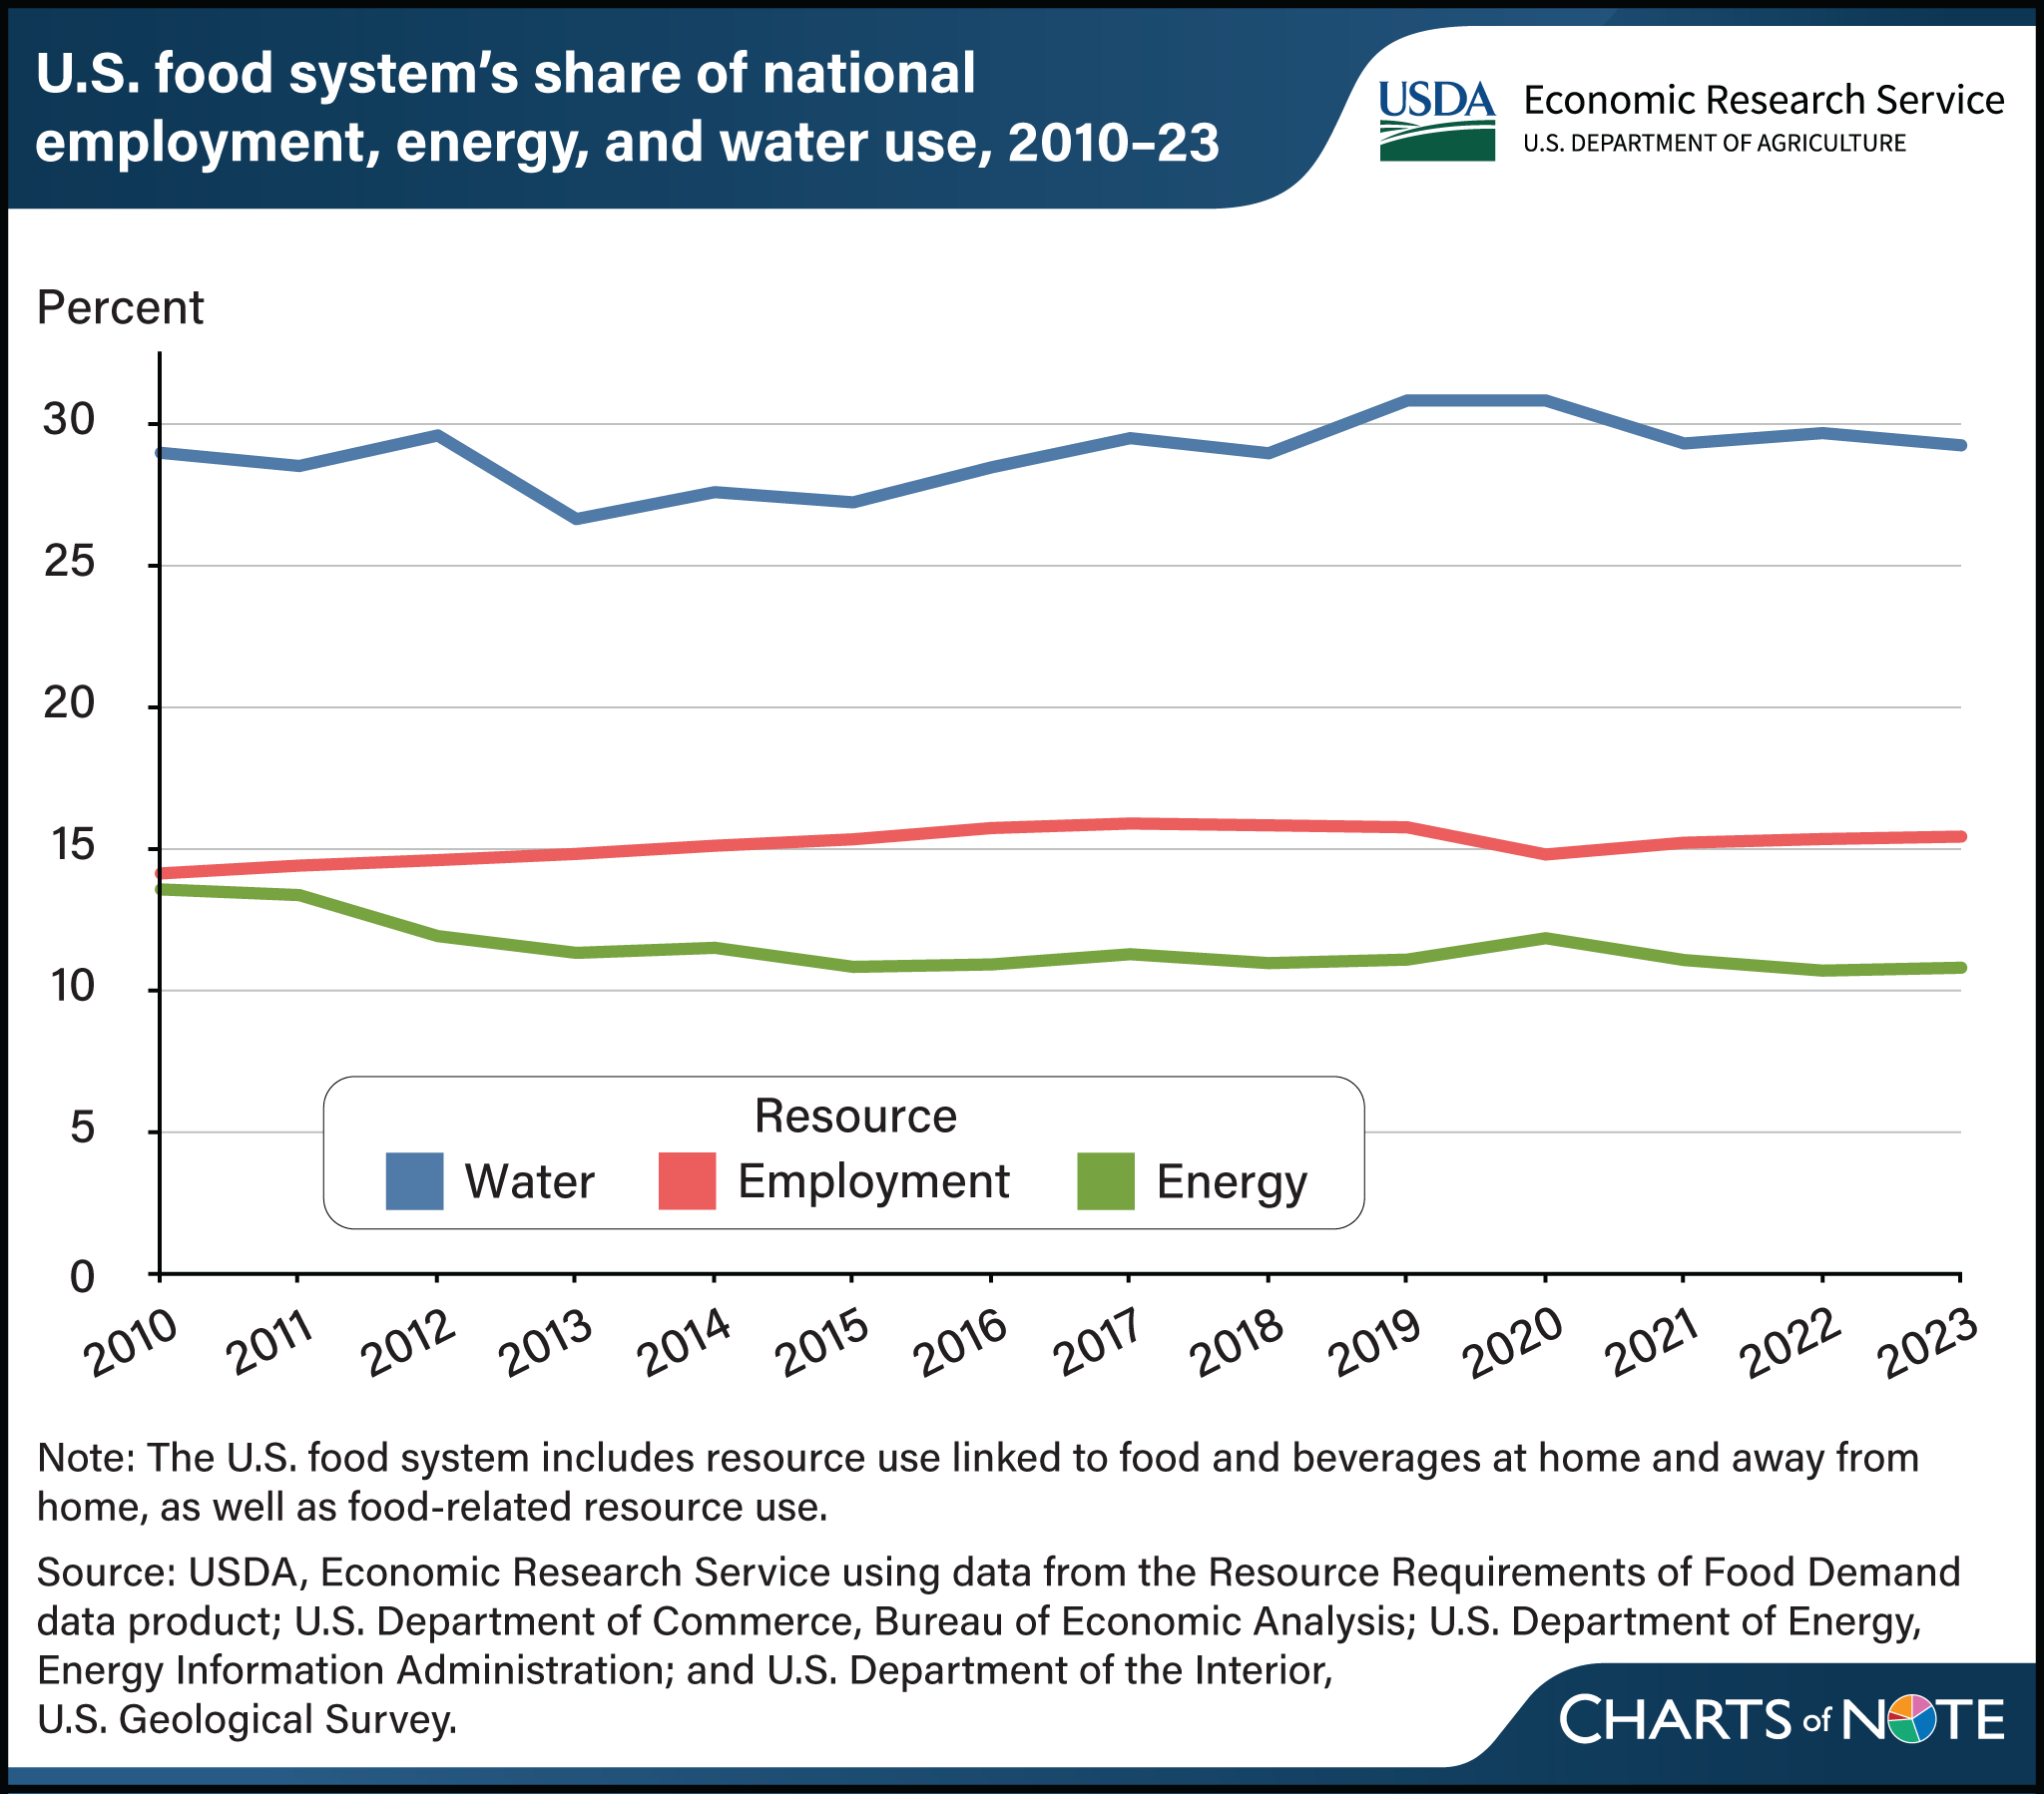
Water, labor, and energy are resources relied upon throughout the U.S. food system. The food system comprehensively required more than a quarter of total U.S. freshwater use each year from 2010 to 2023. Both U.S. food system employment and energy have comparatively lower shares of their national totals annually. In 2023, the U.S. food system relied on 27.7 trillion gallons of freshwater, or 29.3 percent of total freshwater withdrawals. Water use not only had the highest shares relative to the other resources but also was the most variable over this period, ranging from 26.7 to 30.9 percent. By comparison, the U.S. food system employed 25 million workers in 2023, representing 15.5 percent of the U.S. workforce. The U.S. food system also relied on 10.8 percent of all energy used in the United States in 2023, with about half of this in the form of electricity. These estimates are from the recently launched Resource Requirements of Food Demand (RRFD) data product and discussed in a recorded webinar. RRFD measures resource use in the U.S. food system from farm inputs to households, including the resources used to market and transport imported food and beverages. This chart is drawn from USDA, Economic Research Service’s RRFD data product, updated March 2026.
We’d welcome your feedback!
Would you be willing to answer a few quick questions about your experience?