




U.S. watermelon production reached 3.87 billion pounds in 2025, with Georgia leading output
- by Helen Wakefield
- 9/23/2026
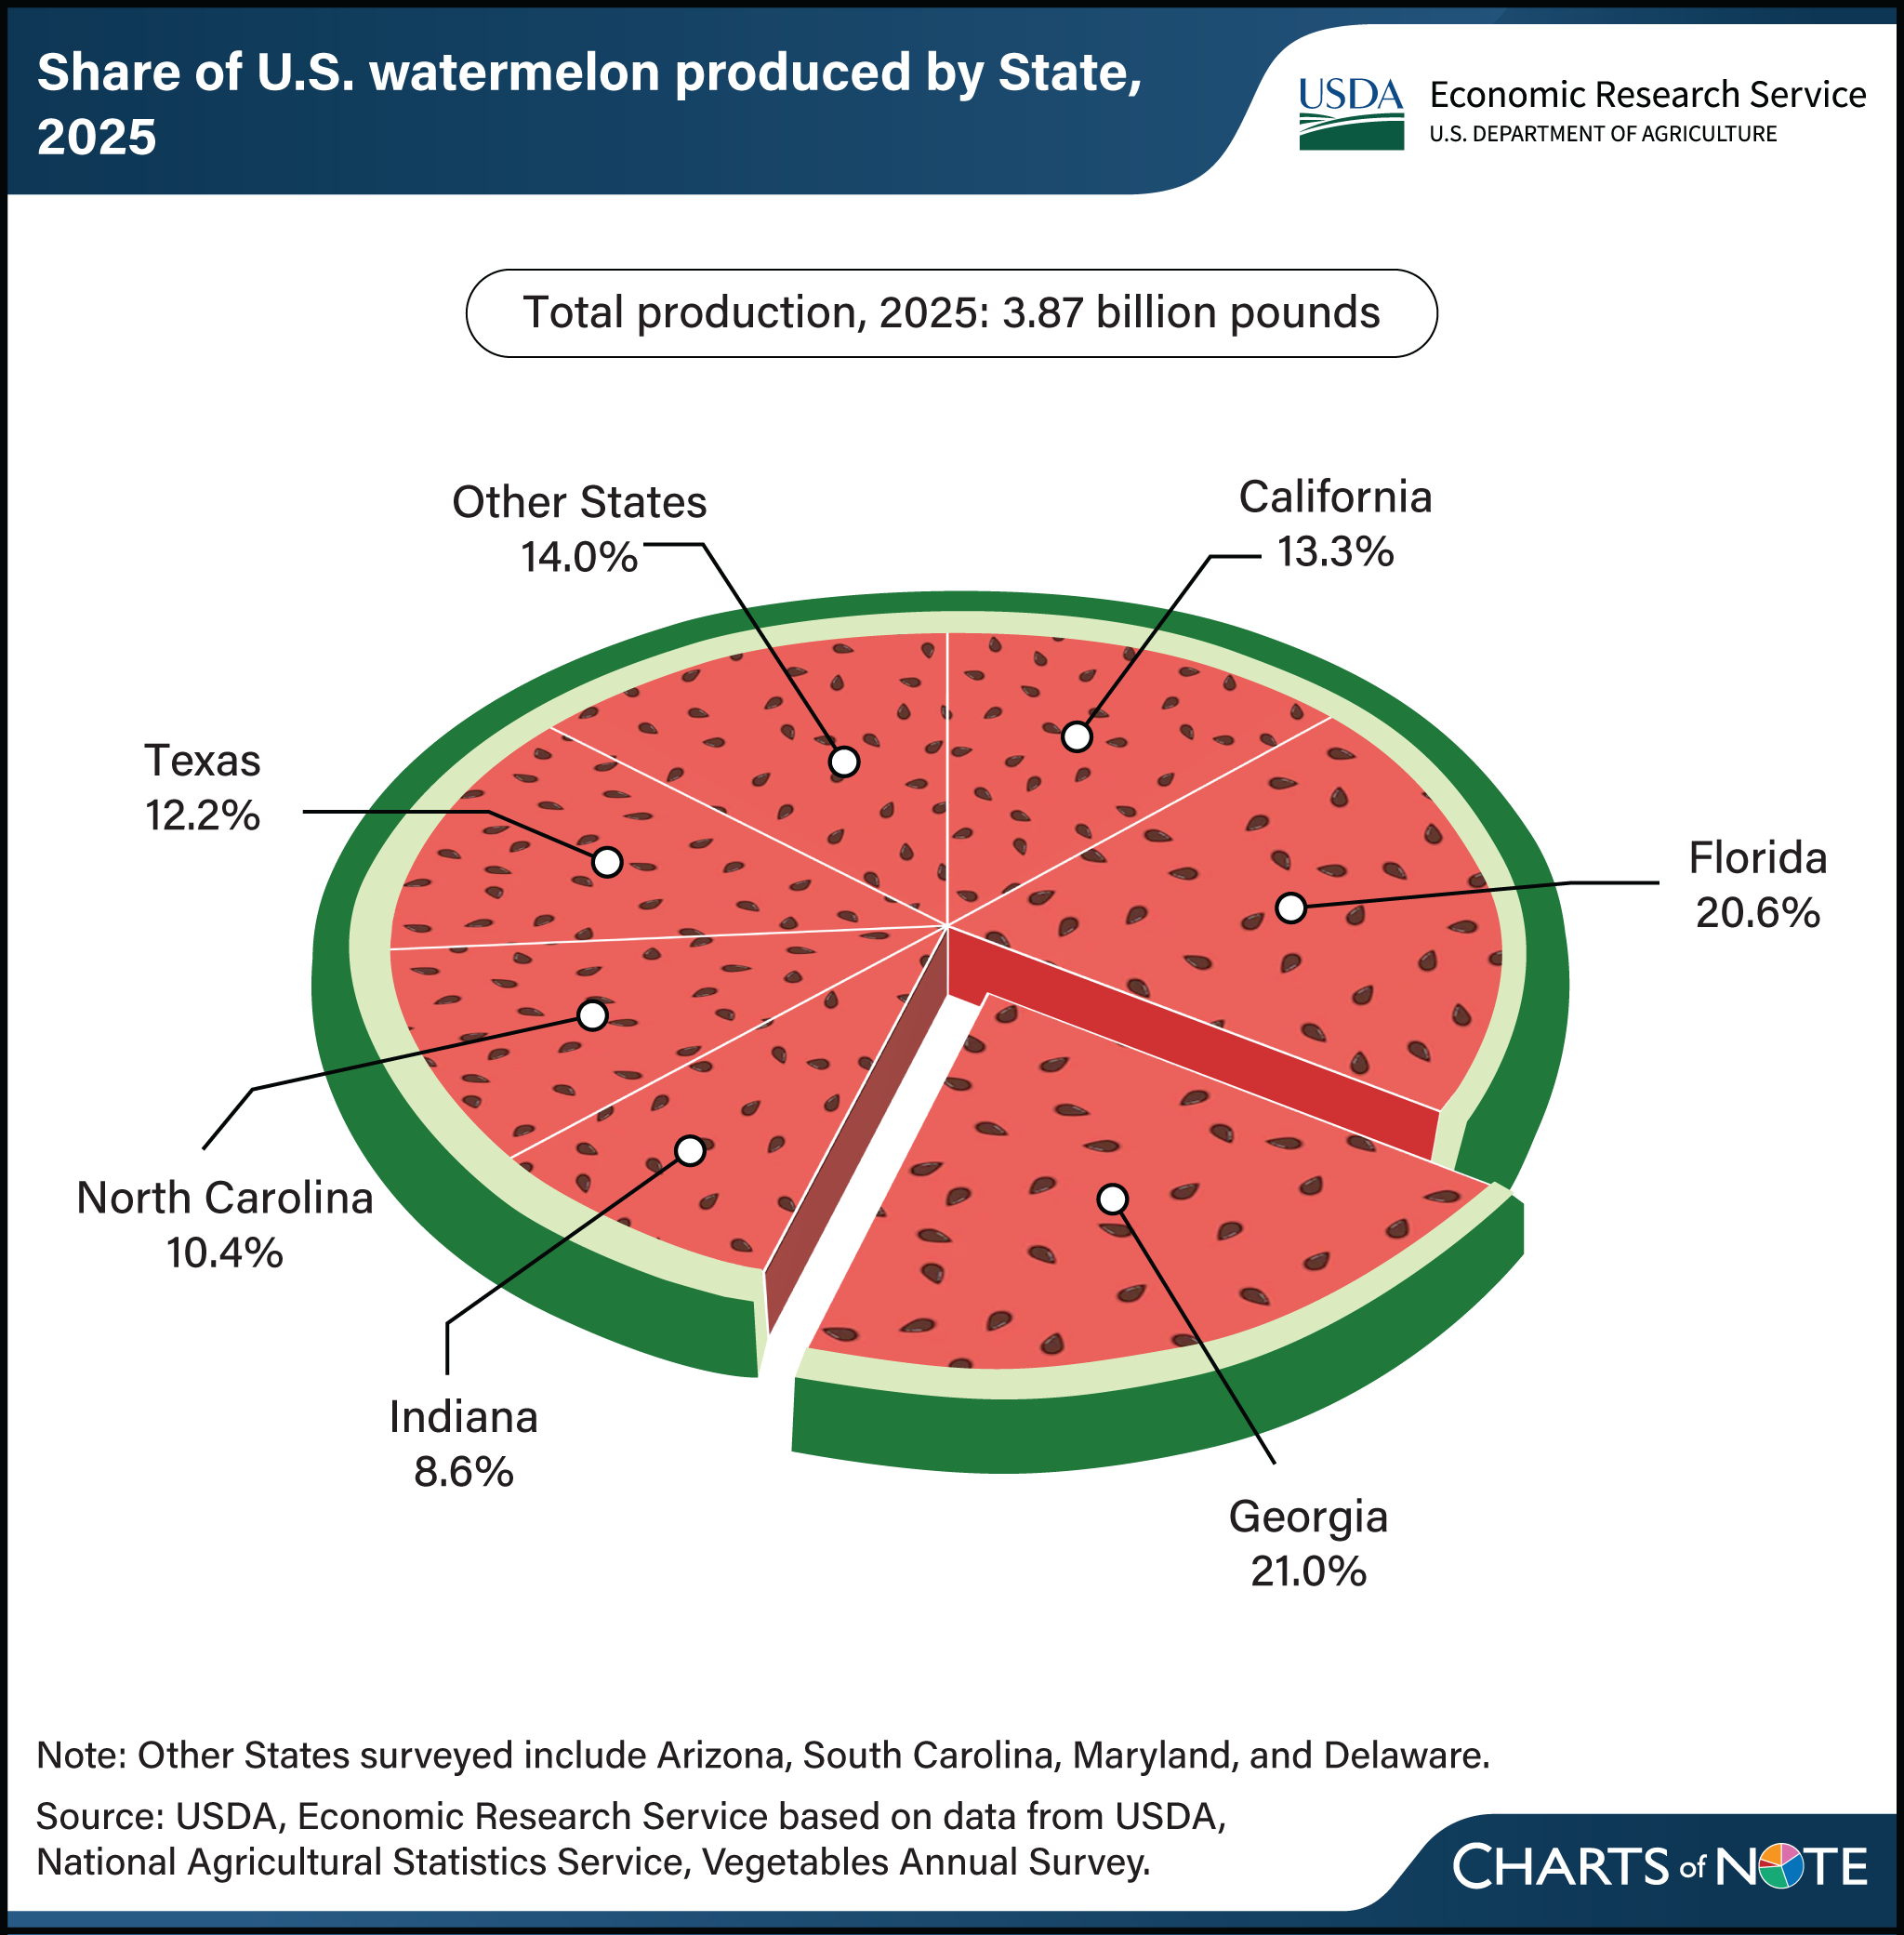
Watermelon is a popular fresh fruit choice, reaching peak availability in time for summer cookouts and backyard gatherings. In 2024, it ranked third in U.S. fresh fruit per capita availability behind only bananas and apples. At just over 15 pounds available per person, watermelon’s availability is double the share of every other melon variety combined. Watermelon’s popularity is supported by strong domestic production, spanning more than 100,000 acres across the country. In 2025, the United States produced 3.87 billion pounds of watermelons. Georgia surpassed Florida as the top watermelon-producing State in 2025, with production reaching 813 million pounds and accounting for 21.0 percent of total U.S. production. Georgia’s production rose year over year because of both an increase in acreage and above average yields in 2025. Florida produced 798 million pounds of watermelon, accounting for 20.6 percent of production. California, Texas, North Carolina, and Indiana collectively harvested an additional 44.4 percent of production last year. As a warm-season crop, watermelon cultivation in the United States begins in the spring and ends in the early fall, with shipments typically peaking around July. To supplement year-round availability, fresh watermelon is also imported, with imports reaching seasonal highs in May and rising again in October as the domestic season winds down. In 2025, imports totaled 1.8 billion pounds, representing 34 percent of domestic supply. This chart is drawn from the USDA, Economic Research Service Fruit and Tree Nuts Outlook, March 2026.
We’d welcome your feedback!
Would you be willing to answer a few quick questions about your experience?