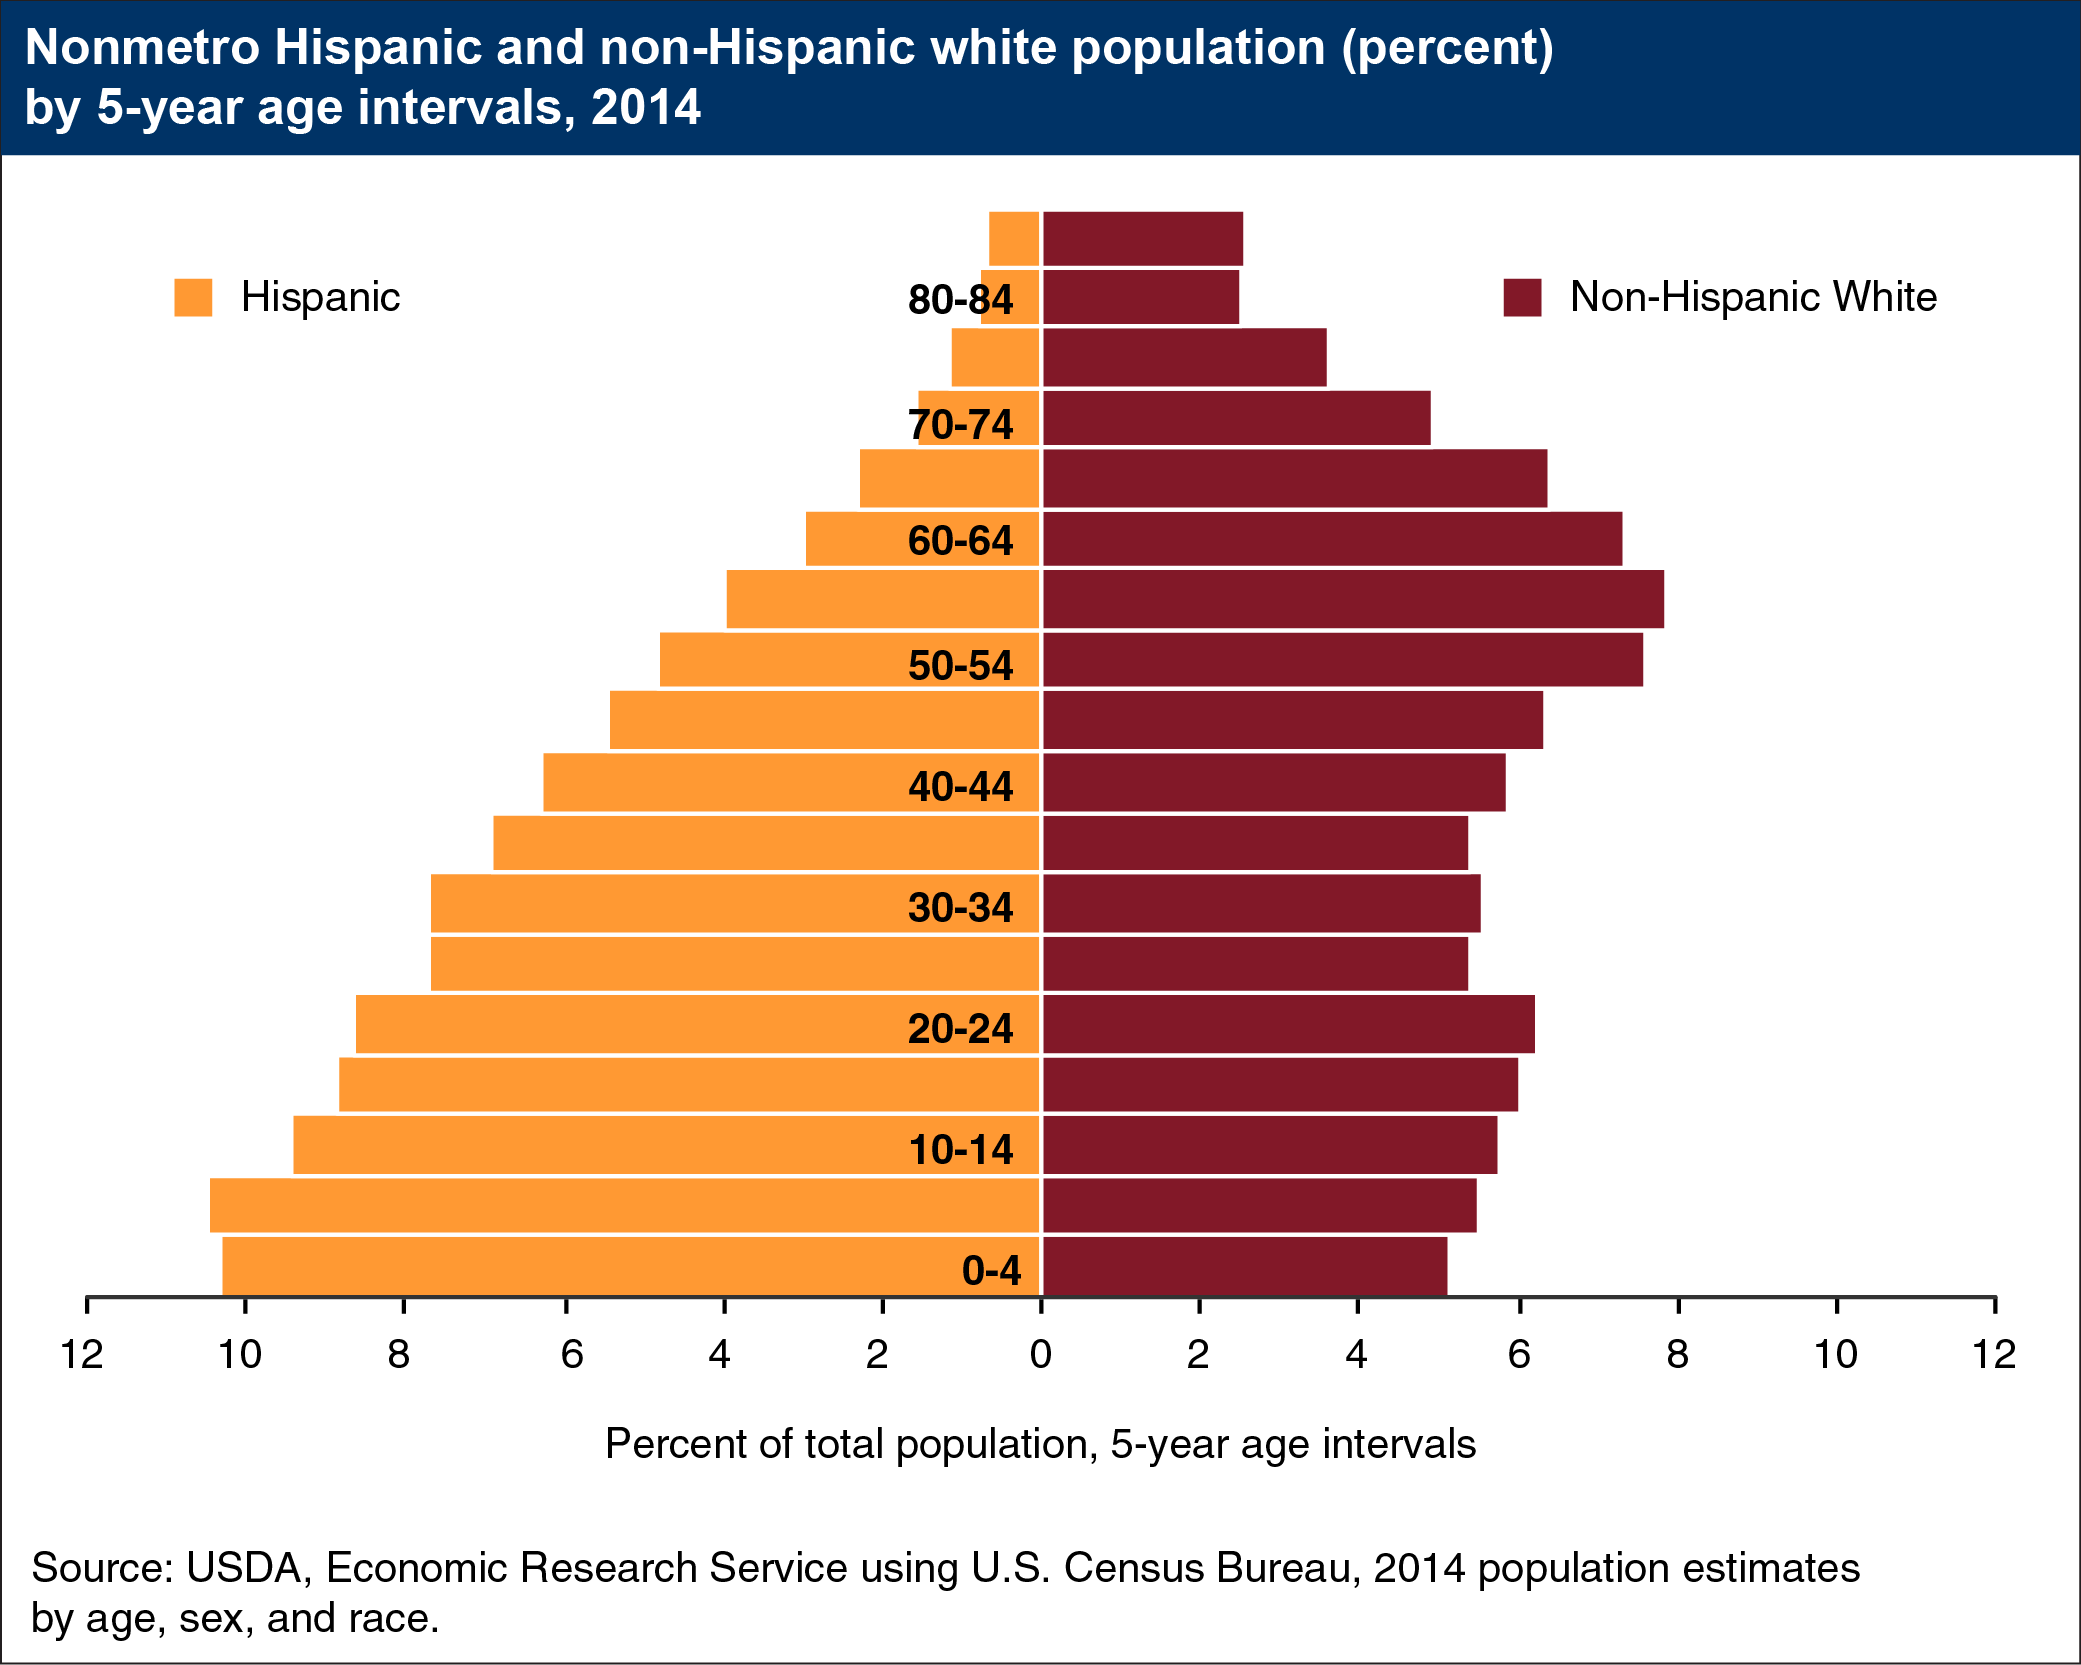
Nonmetro Hispanics tend to be younger than non-Hispanics
- by Timothy Parker and John Cromartie
- 9/28/2015

Nonmetro America is likely to become more ethnically diverse in the coming years; the proportion of Hispanics will increase due to their younger age structure and higher birth rates compared with non-Hispanic Whites. In nonmetro counties as a whole, 48 percent of the Hispanic population is under the age of 25, compared with 29 percent of non-Hispanic Whites. According to data from the American Community Survey, in 2014, the median age for nonmetro Hispanics was 26.0 years, much lower than the median of 44.3 years for non-Hispanic Whites. For the country as a whole, 2013 data from the National Center for Health Statistics show that there were 72.9 births per every 1,000 Hispanic women ages 15-44, compared with 58.7 births per 1,000 non-Hispanic White women of the same age. During 2010-14, the nonmetro Hispanic population increased by 8.6 percent, while the nonmetro non-Hispanic White population declined by 1.6 percent. The overall nonmetro population loss of -0.25 percent between 2010 and 2014 would have been much larger had it not been for the growth in the Hispanic population. This chart updates one found in Rural Hispanics At A Glance, EIB-8.


