

U.S. consumers’ food spending hit record high in 2022
- by Eliana Zeballos and Wilson Sinclair
- 7/17/2023
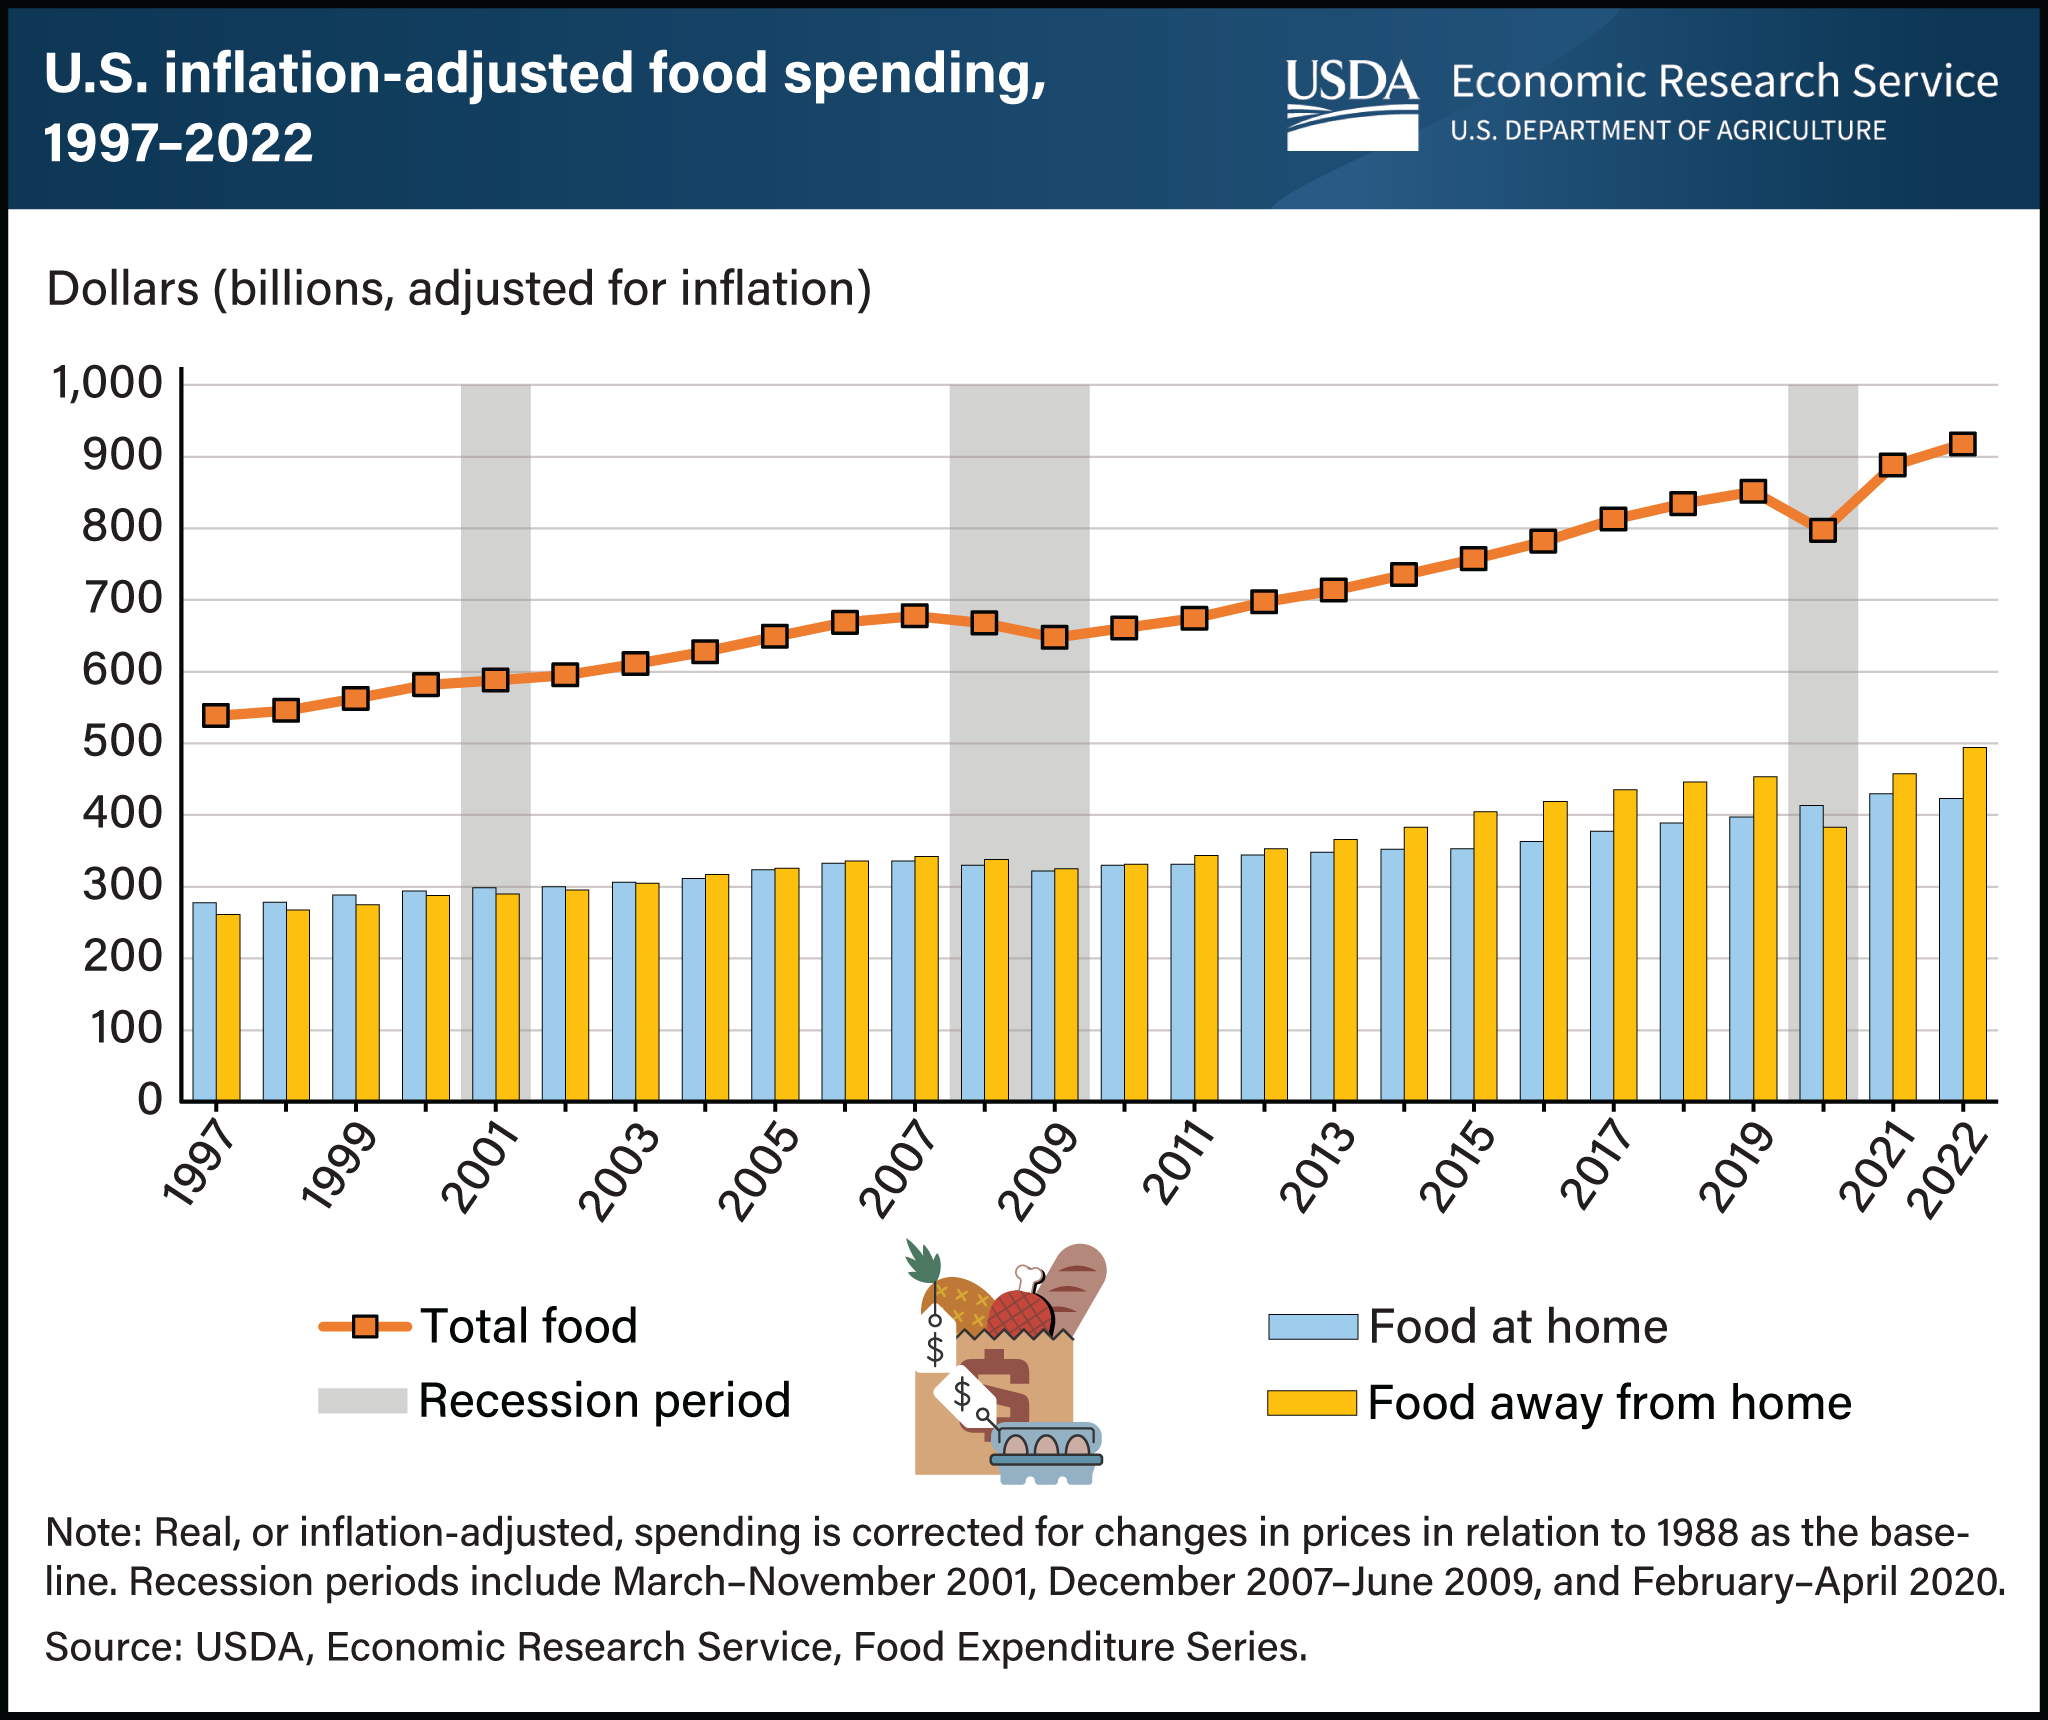
Real, or inflation-adjusted, annual food spending in the United States increased steadily from 1997 to 2022, except in 2008 and 2009 during the Great Recession and in 2020 during the Coronavirus (COVID-19) pandemic. Food spending includes food at home (FAH), described as food intended for off-premises consumption from retailers such as grocery stores, and food away from home (FAFH), described as food purchased at outlets such as restaurants or cafeterias. Total food spending increased 70 percent from 1997 to 2022. During this period, FAH spending increased at a slower rate (53 percent) than for FAFH (89 percent). Total food spending increased on an annual basis by 7.2 percent in 2021 and 4.5 percent in 2022. FAFH spending increases (19 percent in 2021 and 8 percent in 2022) drove overall increases in food spending. FAH spending increased by 4 percent in 2021 but fell by 2 percent in 2022. The data for this chart come from the USDA Economic Research Service’s Food Expenditure Series data product, updated in June 2023.