
Nonmetro population change has remained near zero in recent years
- by John Cromartie
- 10/30/2020
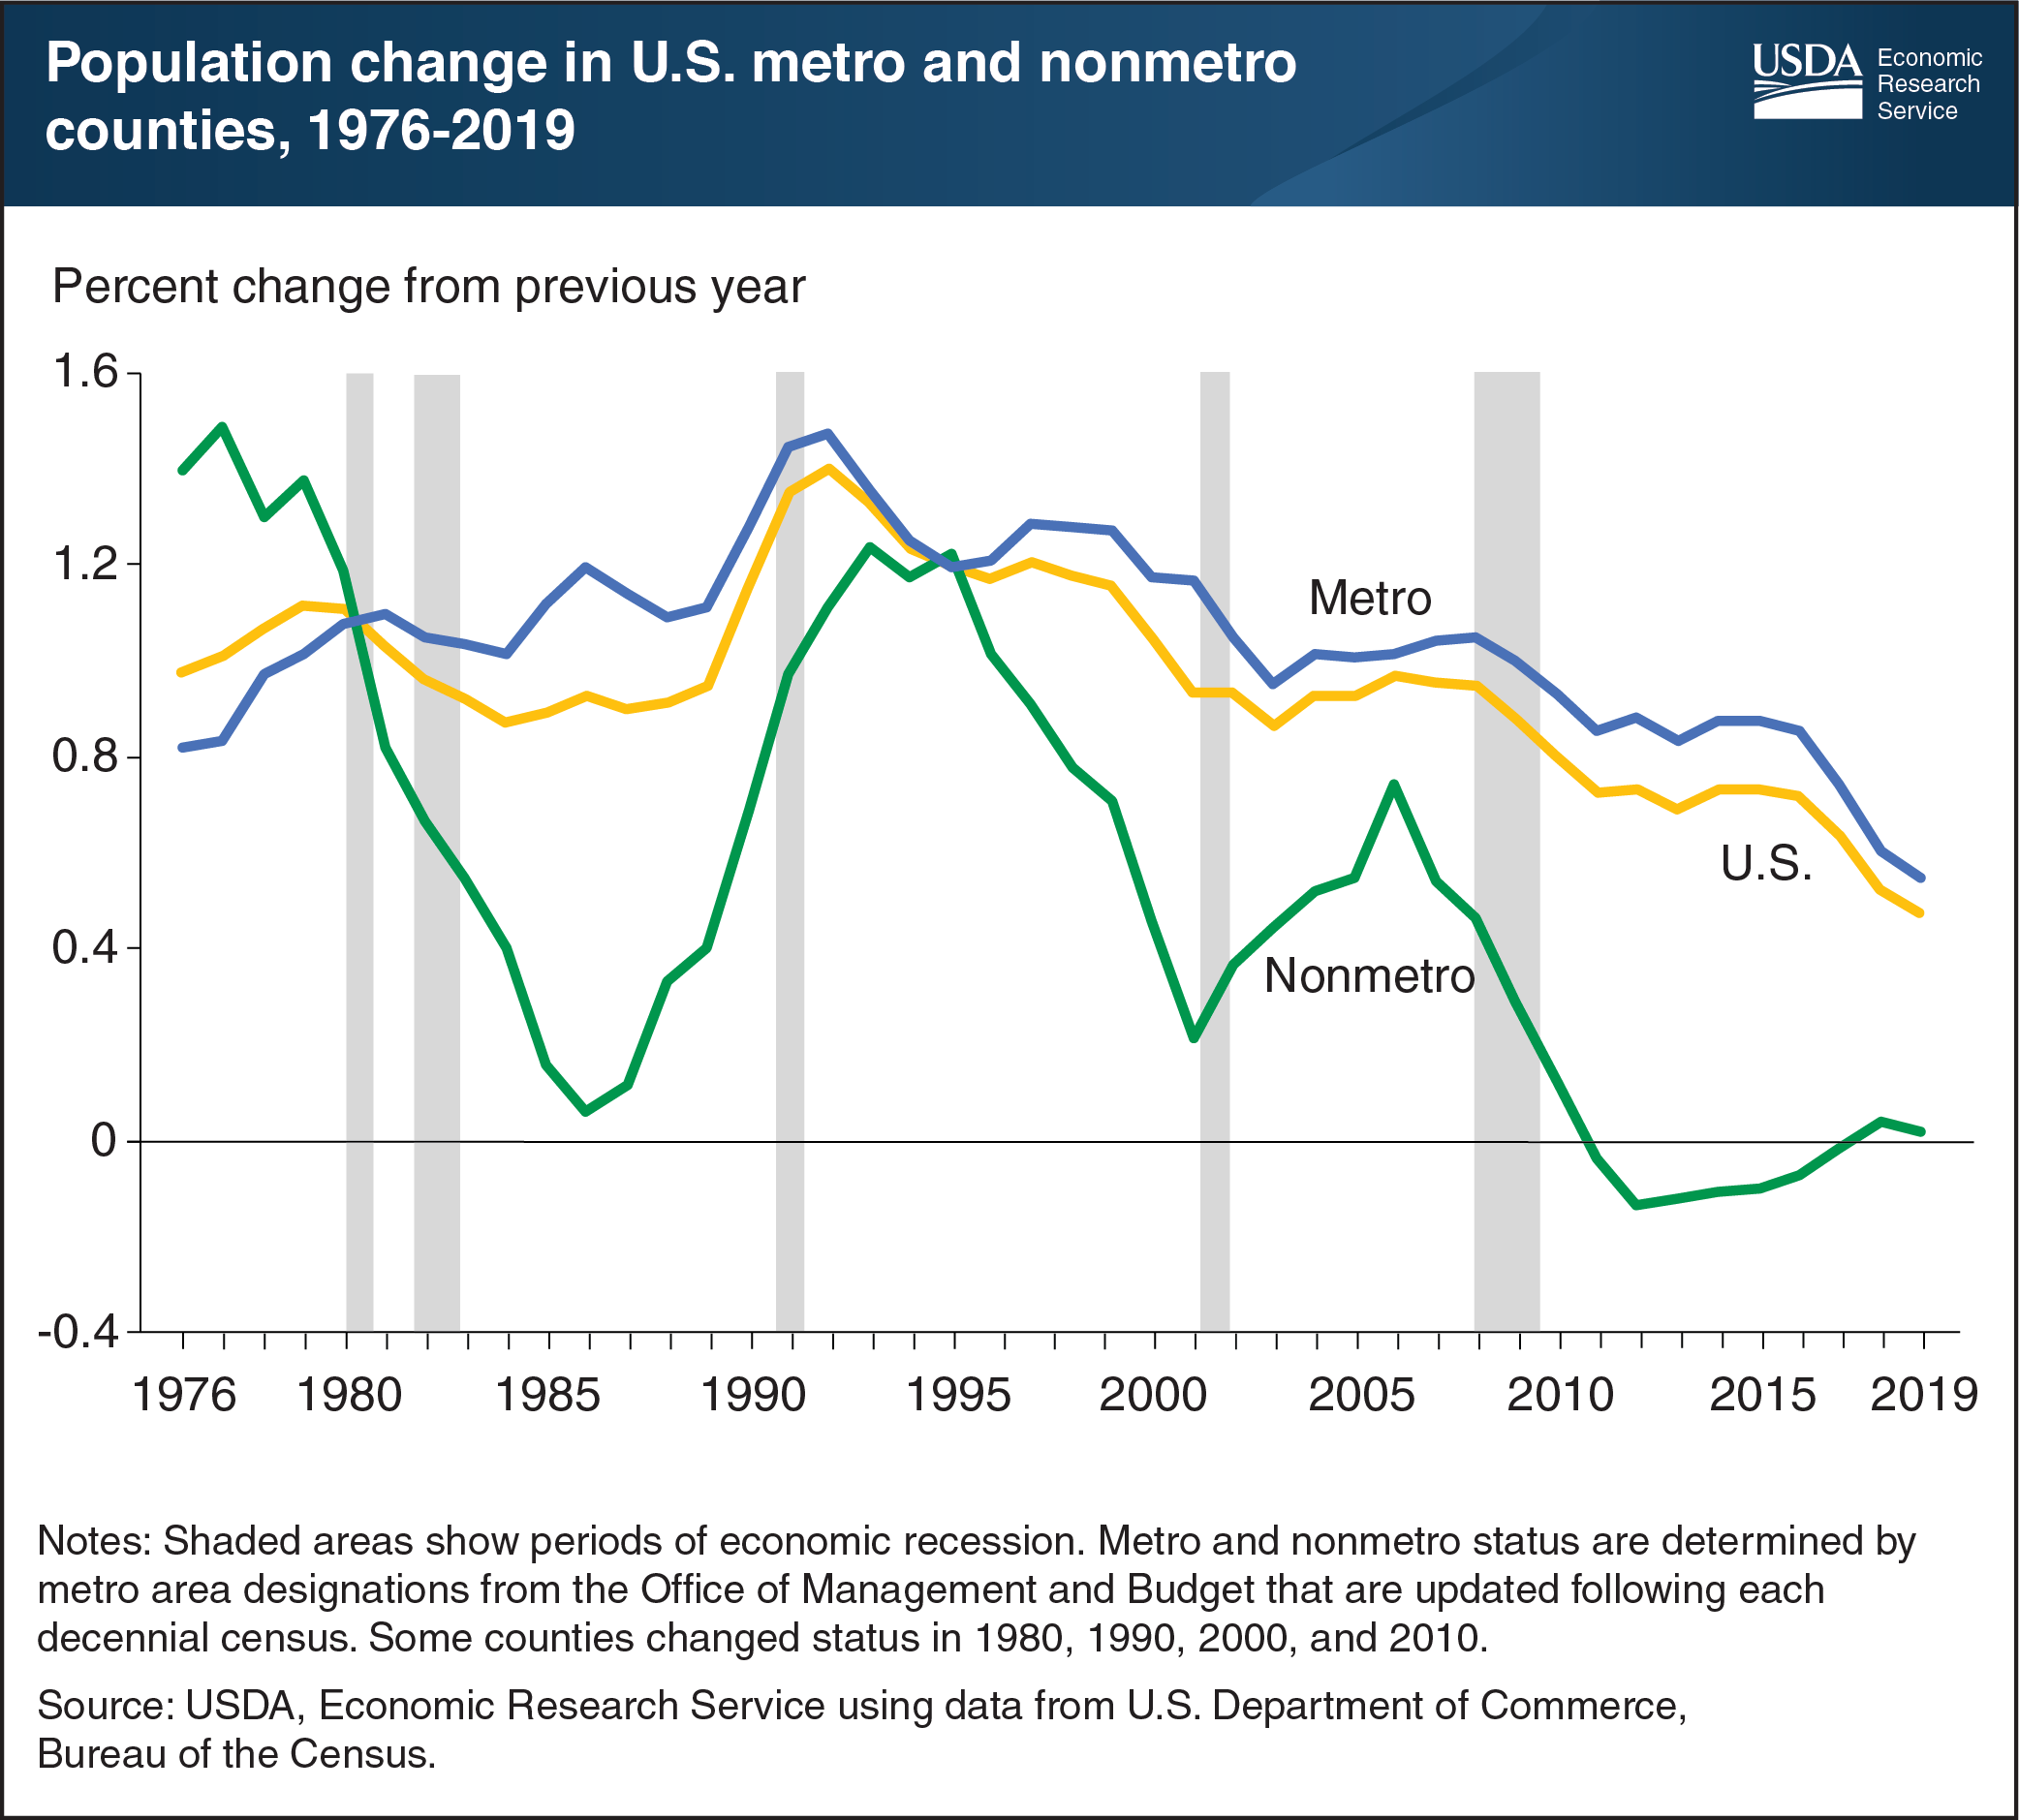
The U.S. population in nonmetro (rural) counties stood at 46.1 million in July 2019, accounting for 14 percent of U.S. residents spread across 72 percent of the Nation's land area. Nonmetro population growth has remained close to zero in recent years and was just 0.02 percent from July 2018 to July 2019, according to the latest county population estimates from the U.S. Department of Commerce, Bureau of the Census. As in previous periods of economic difficulties, such as in the mid-1980s and early 2000s, nonmetro America experienced a steep decline in population growth rates during the Great Recession. Unlike those previous periods of difficulty, the post-recession population recovery during the 2010s has been quite slow. Nonmetro population growth fell from a peak of 0.7 percent in 2006-07 to -0.14 percent in 2011-12. The nonmetro growth rate has been lower than in metropolitan (metro) counties since the mid-1990s, and the gap widened considerably in recent years. This chart appears in the July 2020 Amber Waves data feature, “Modest Improvement in Nonmetro Population Change During the Decade Masks Larger Geographic Shifts.”
We’d welcome your feedback!
Would you be willing to answer a few quick questions about your experience?