

Rural poverty rates dropped across all race/ethnicity groups between 2013 and 2018
- by Tracey Farrigan
- 8/17/2020
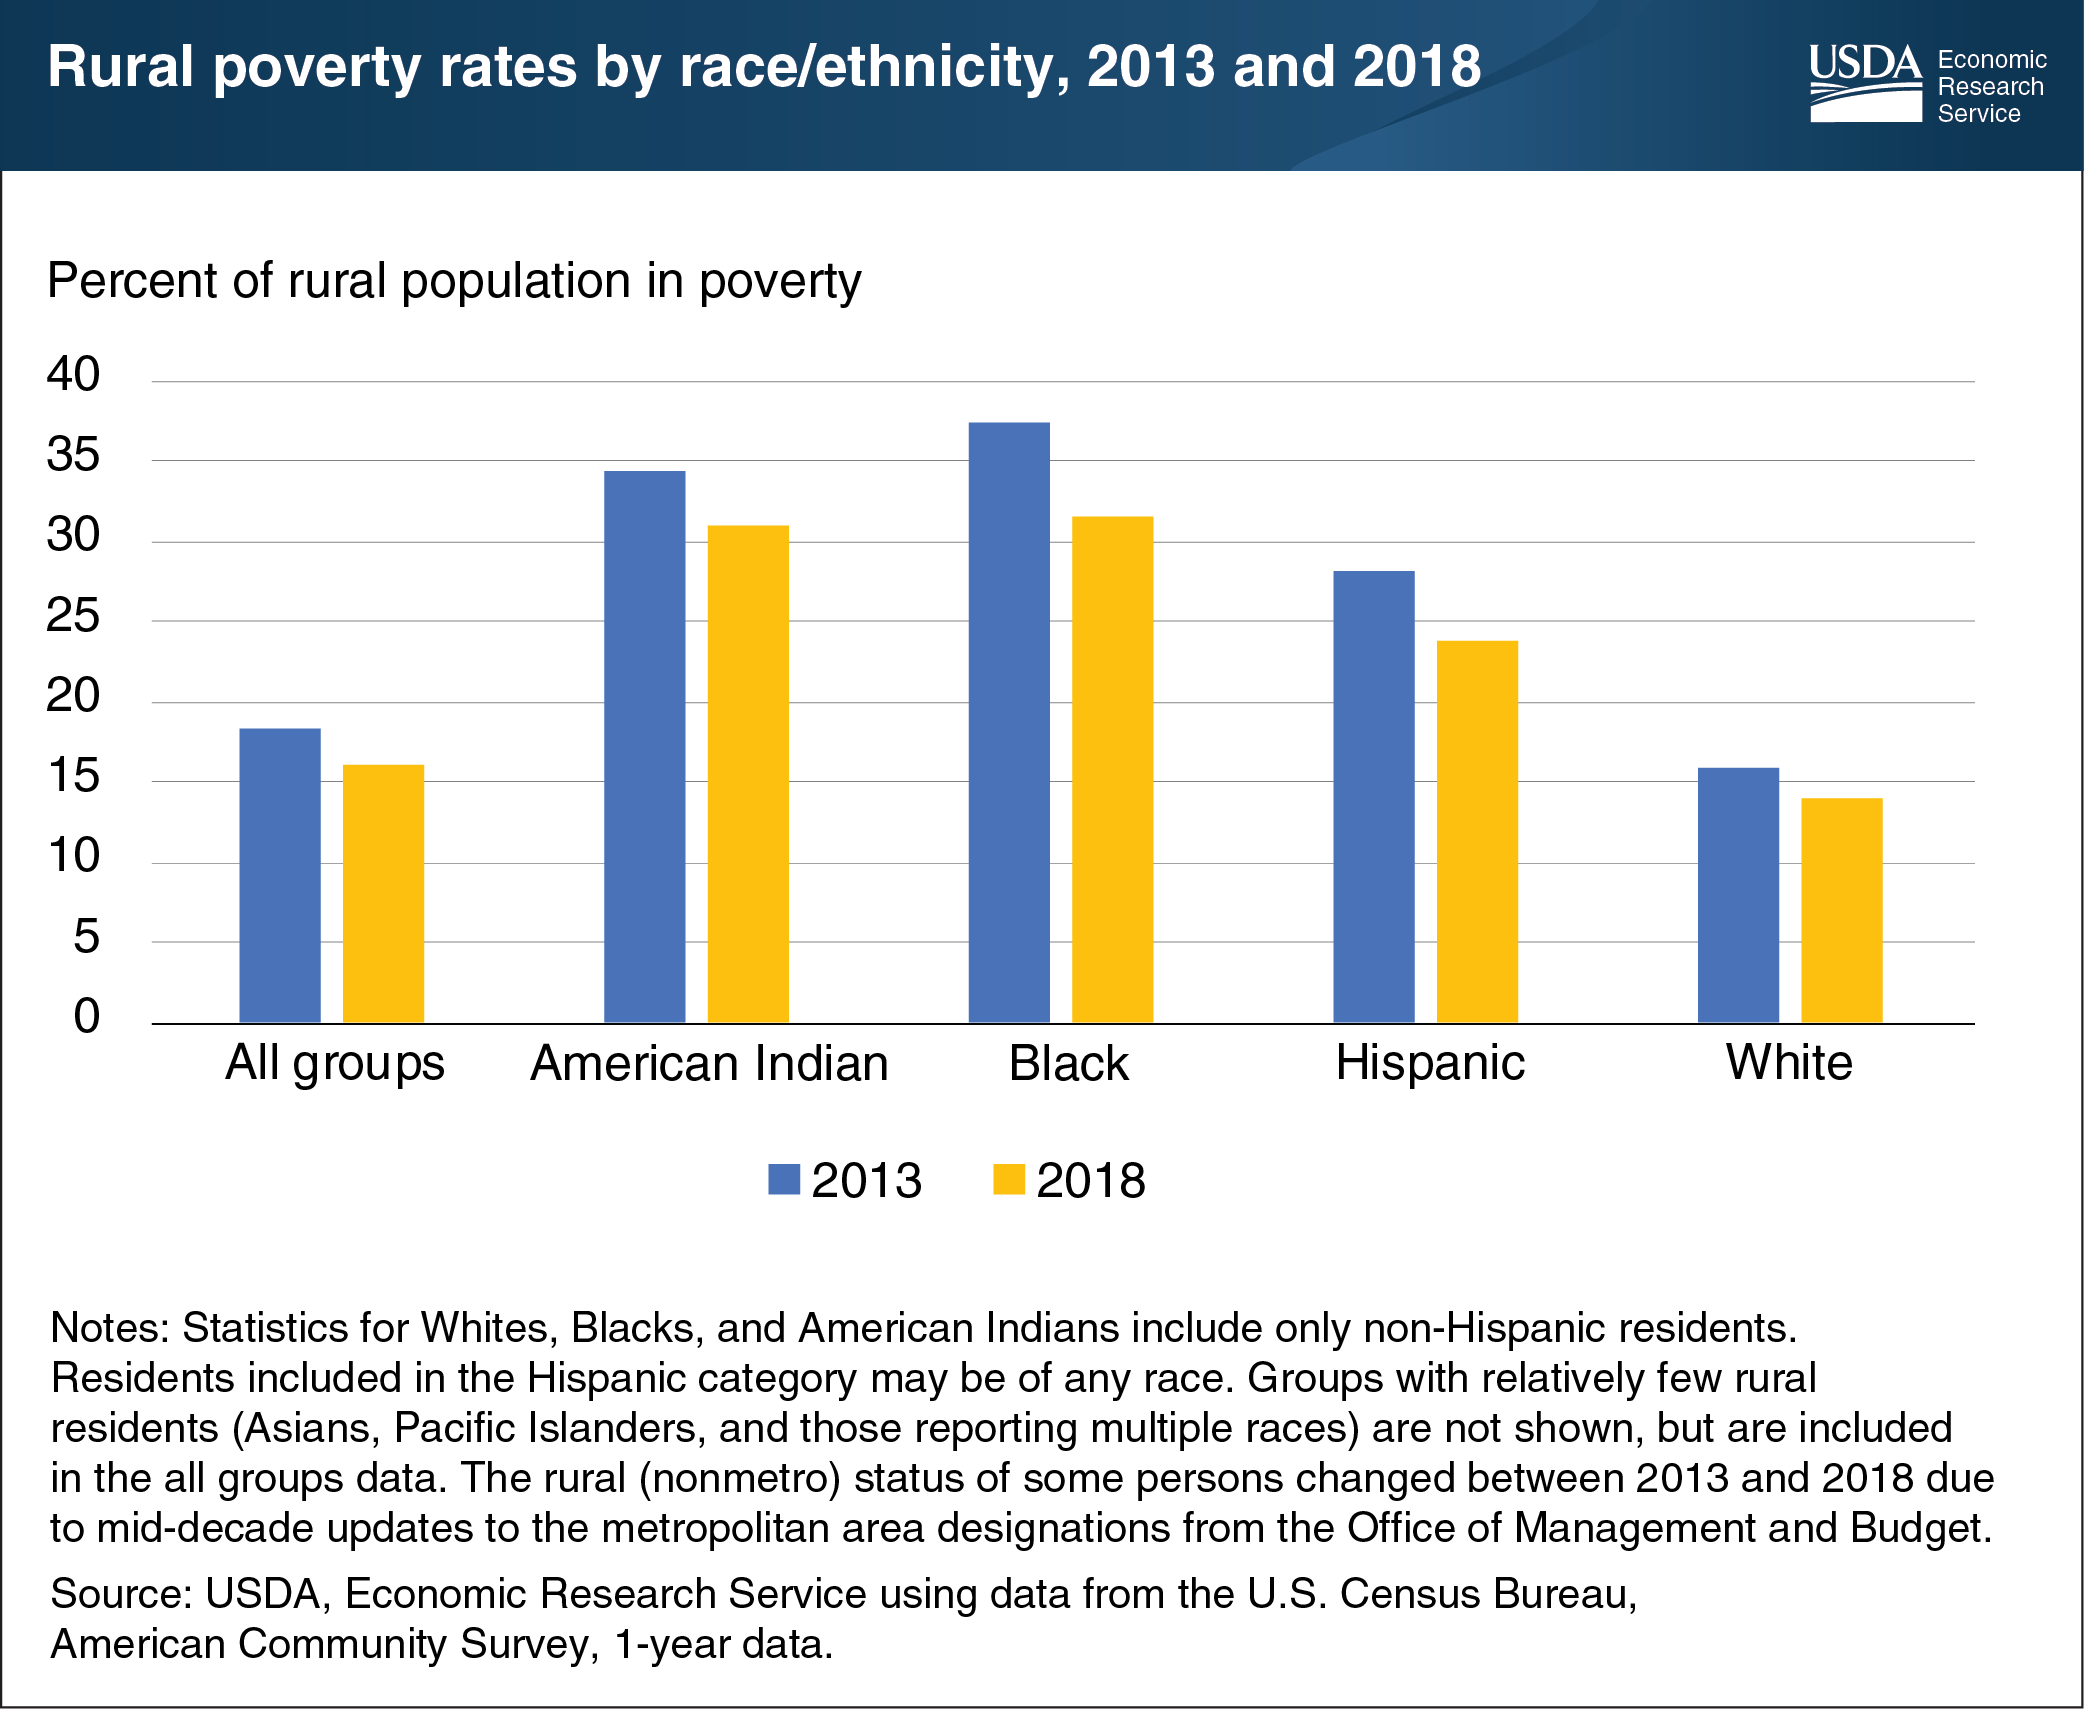
In 2013, rural poverty reached a 30-year peak at 18.4 percent of the rural population. Between 2013 and 2018, the rural poverty rate fell 2.3 percentage points, a decline of about 1 million rural residents in poverty. Rural poverty rates declined for all race/ethnicity groups. The rural Black population showed the largest decline in poverty rates, from 37.3 percent in 2013 to 31.6 percent in 2018. Despite this decrease, Blacks continued to have the highest poverty rate among all rural race/ethnicity groups. While Blacks made up 7.6 percent of the rural population, they accounted for 14.9 percent of the rural poor in 2018. American Indians had the second-highest poverty rate (30.9 percent) among all rural race/ethnicity groups in 2018, 3.5 percentage points lower than in 2013. Hispanics had the lowest poverty rate among rural minority groups (23.8 percent) in 2018, an improvement of 4.4 percentage points from 2013. Whites have historically had a much lower rural poverty rate (14.0 percent in 2018), and their rate fell 1.9 percentage points from 2013 to 2018. However, the majority of the rural poor are White. Whites account for 84.8 percent of the overall rural population and 73.4 percent of the rural population in poverty in 2018. This chart updates data that appeared in the November 2018 ERS report, Rural America at a Glance, 2018 Edition.