

Limited-service and full-service restaurants accounted for 73 percent of food-away-from-home spending in 2019
- by Eliana Zeballos
- 7/24/2020
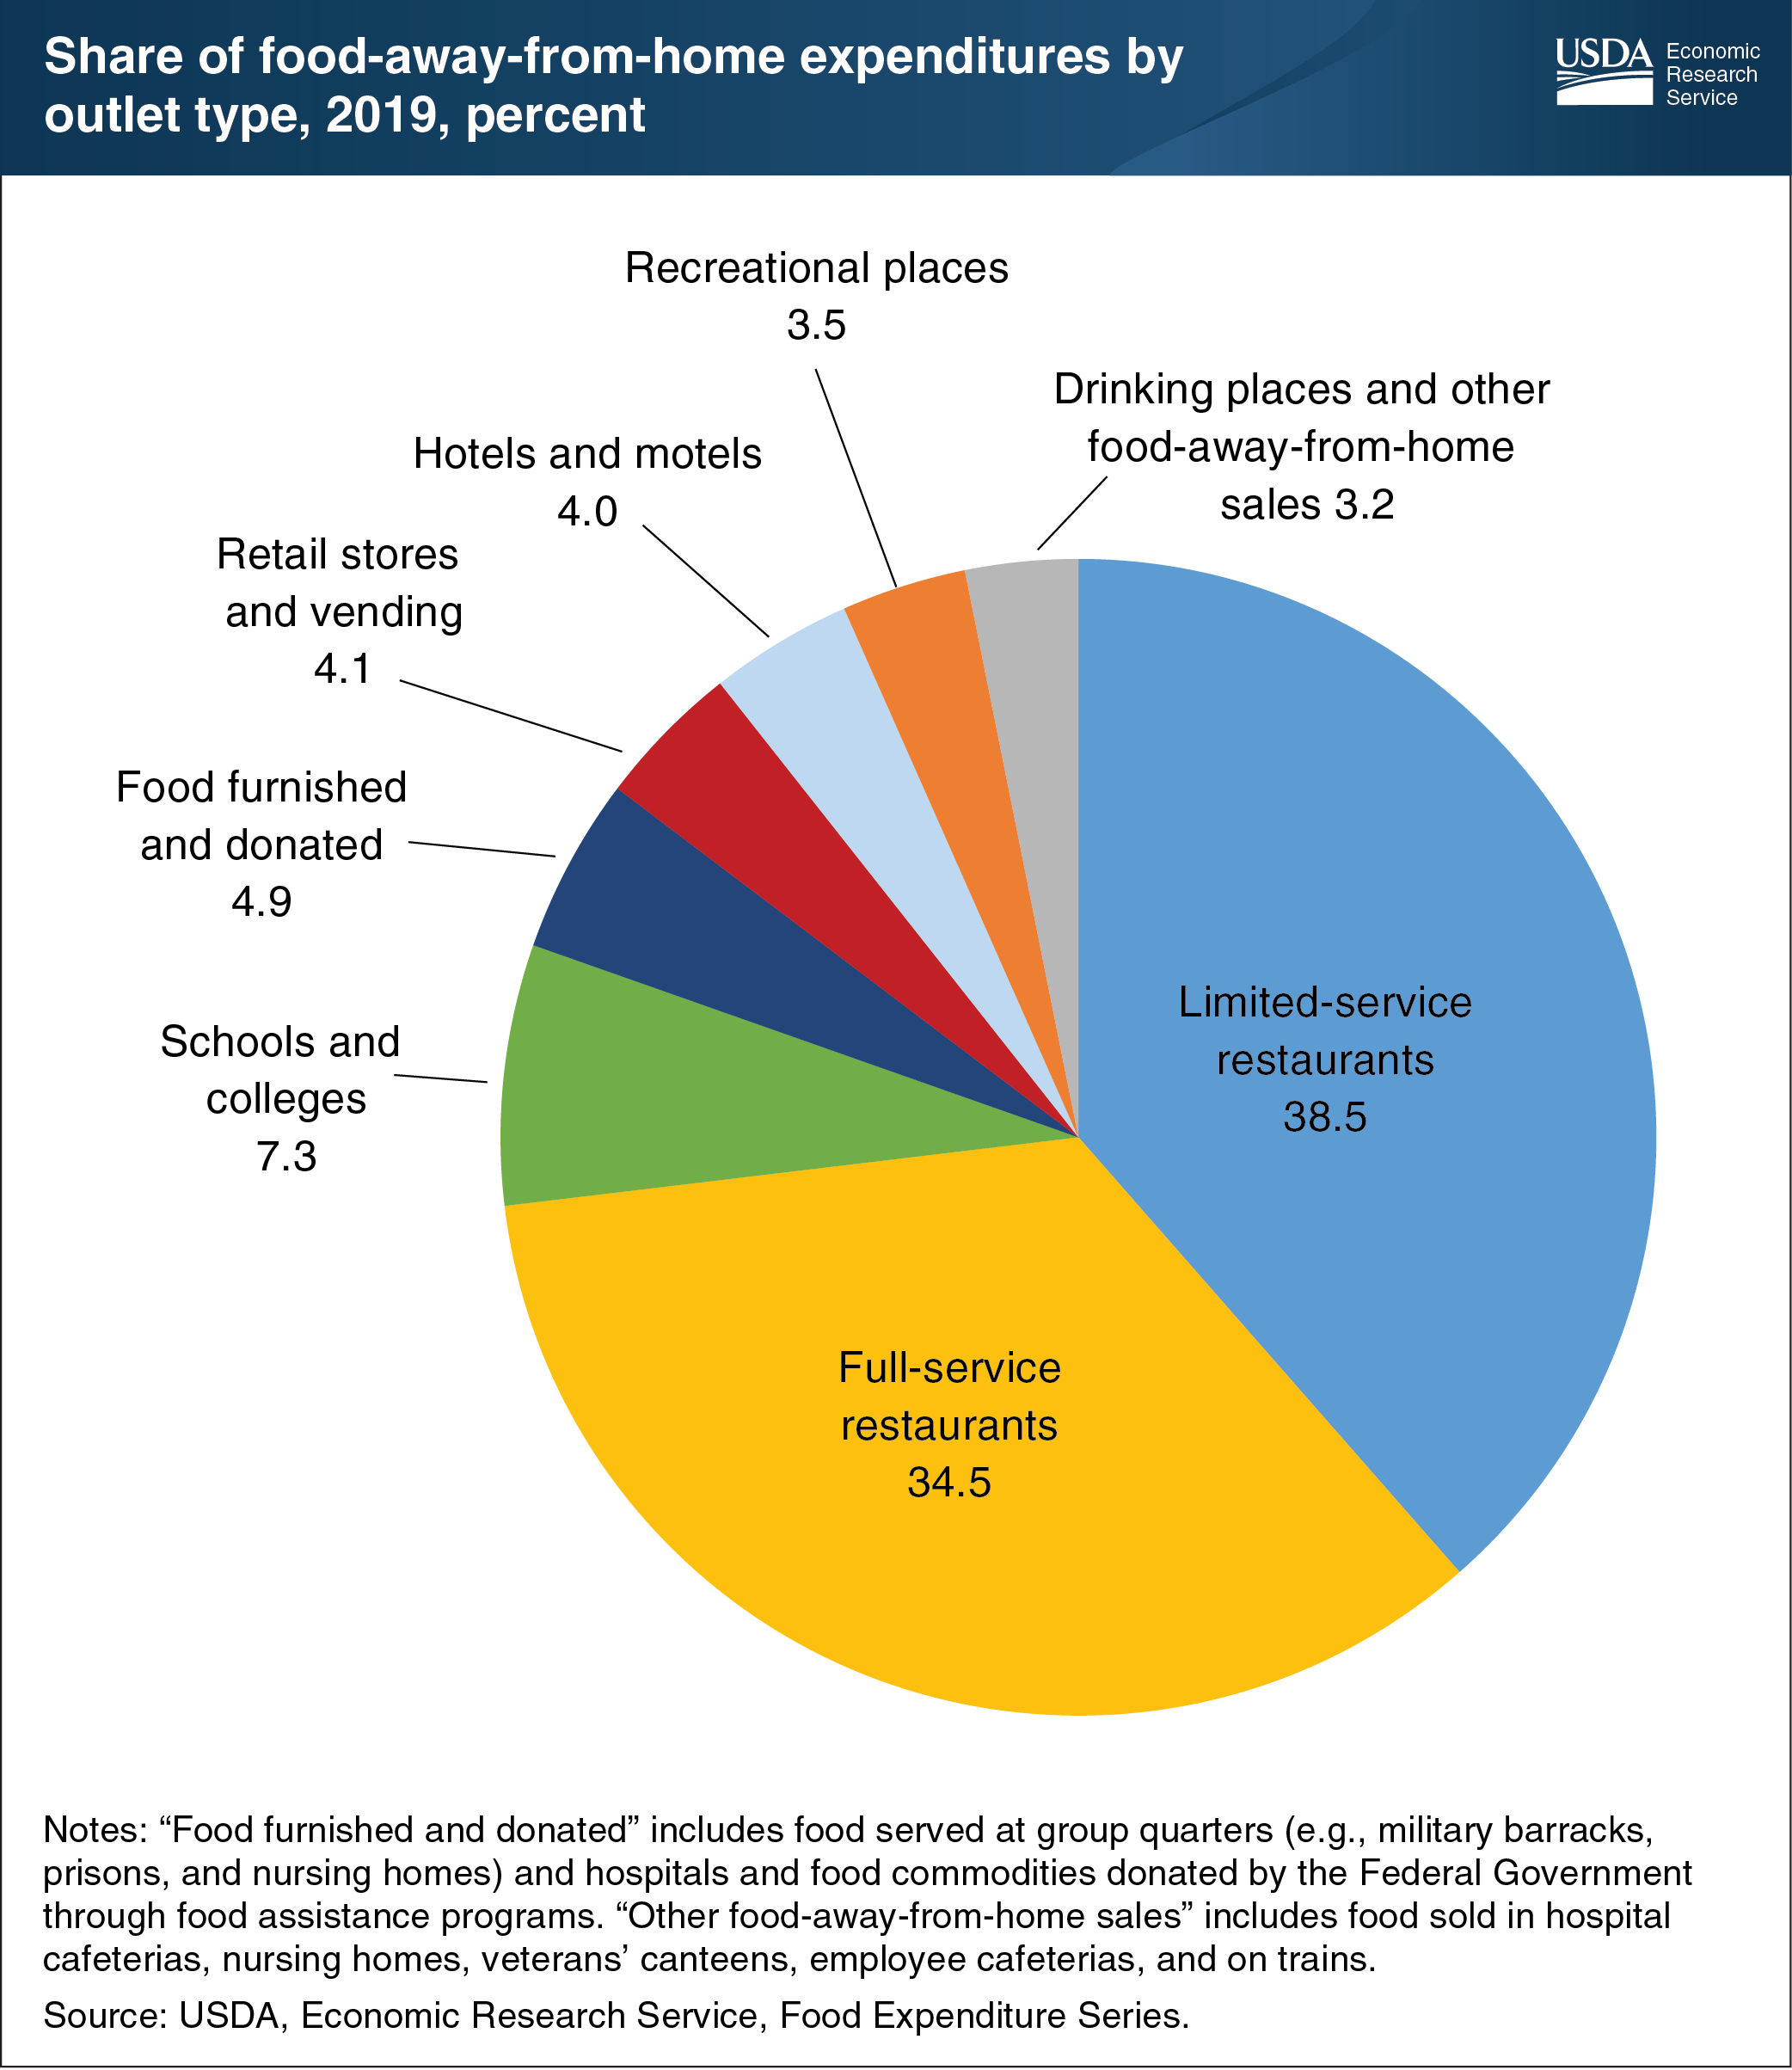
In 2019, U.S. consumers, businesses, and government entities spent $1.8 trillion on foods and beverages, according to the Economic Research Service’s (ERS) Food Expenditure Series. Expenditures at food-away-from-home establishments—restaurants, school cafeterias, sports venues, and other eating places—totaled $969.4 billion in 2019, compared to the $799.4 billion spent on food at home in grocery stores, supercenters, convenience stores, and other retailers. Full-service restaurants with wait staff and limited-service restaurants—where food is ordered and paid for at a counter or drive-thru window—dominate the U.S. food-away-from-home market. Each of these sectors accounted for over a third of food-away-from-home expenditures in 2019. Schools and colleges accounted for 7.3 percent of food-away-from-home expenditures in 2019, followed by retail stores and vending machines (4.1 percent), hotels and motels (4.0 percent), recreational places (3.5 percent), and drinking places and other food-away-from-home sales (3.2 percent). Spending on food furnished in hospitals and in group quarters—such as meals served in military barracks, prisons, and nursing homes—and the value of food commodities donated by the Federal Government totaled $47.6 billion in 2019 and accounted for 4.9 percent of food-away-from-home expenditures. While the data in this chart predate the COVID-19 pandemic, they can provide insight into its potential impact on the food-away-from-home market. The stay-at-home orders that accompanied the pandemic have caused a drop in spending on eating out, and some food-away-from-home sectors have been more affected than others. The data in this chart are from ERS’s Food Expenditure Series data product.