

Productivity growth is the major source of growth in U.S. agricultural output
- by Sun Ling Wang
- 2/19/2020
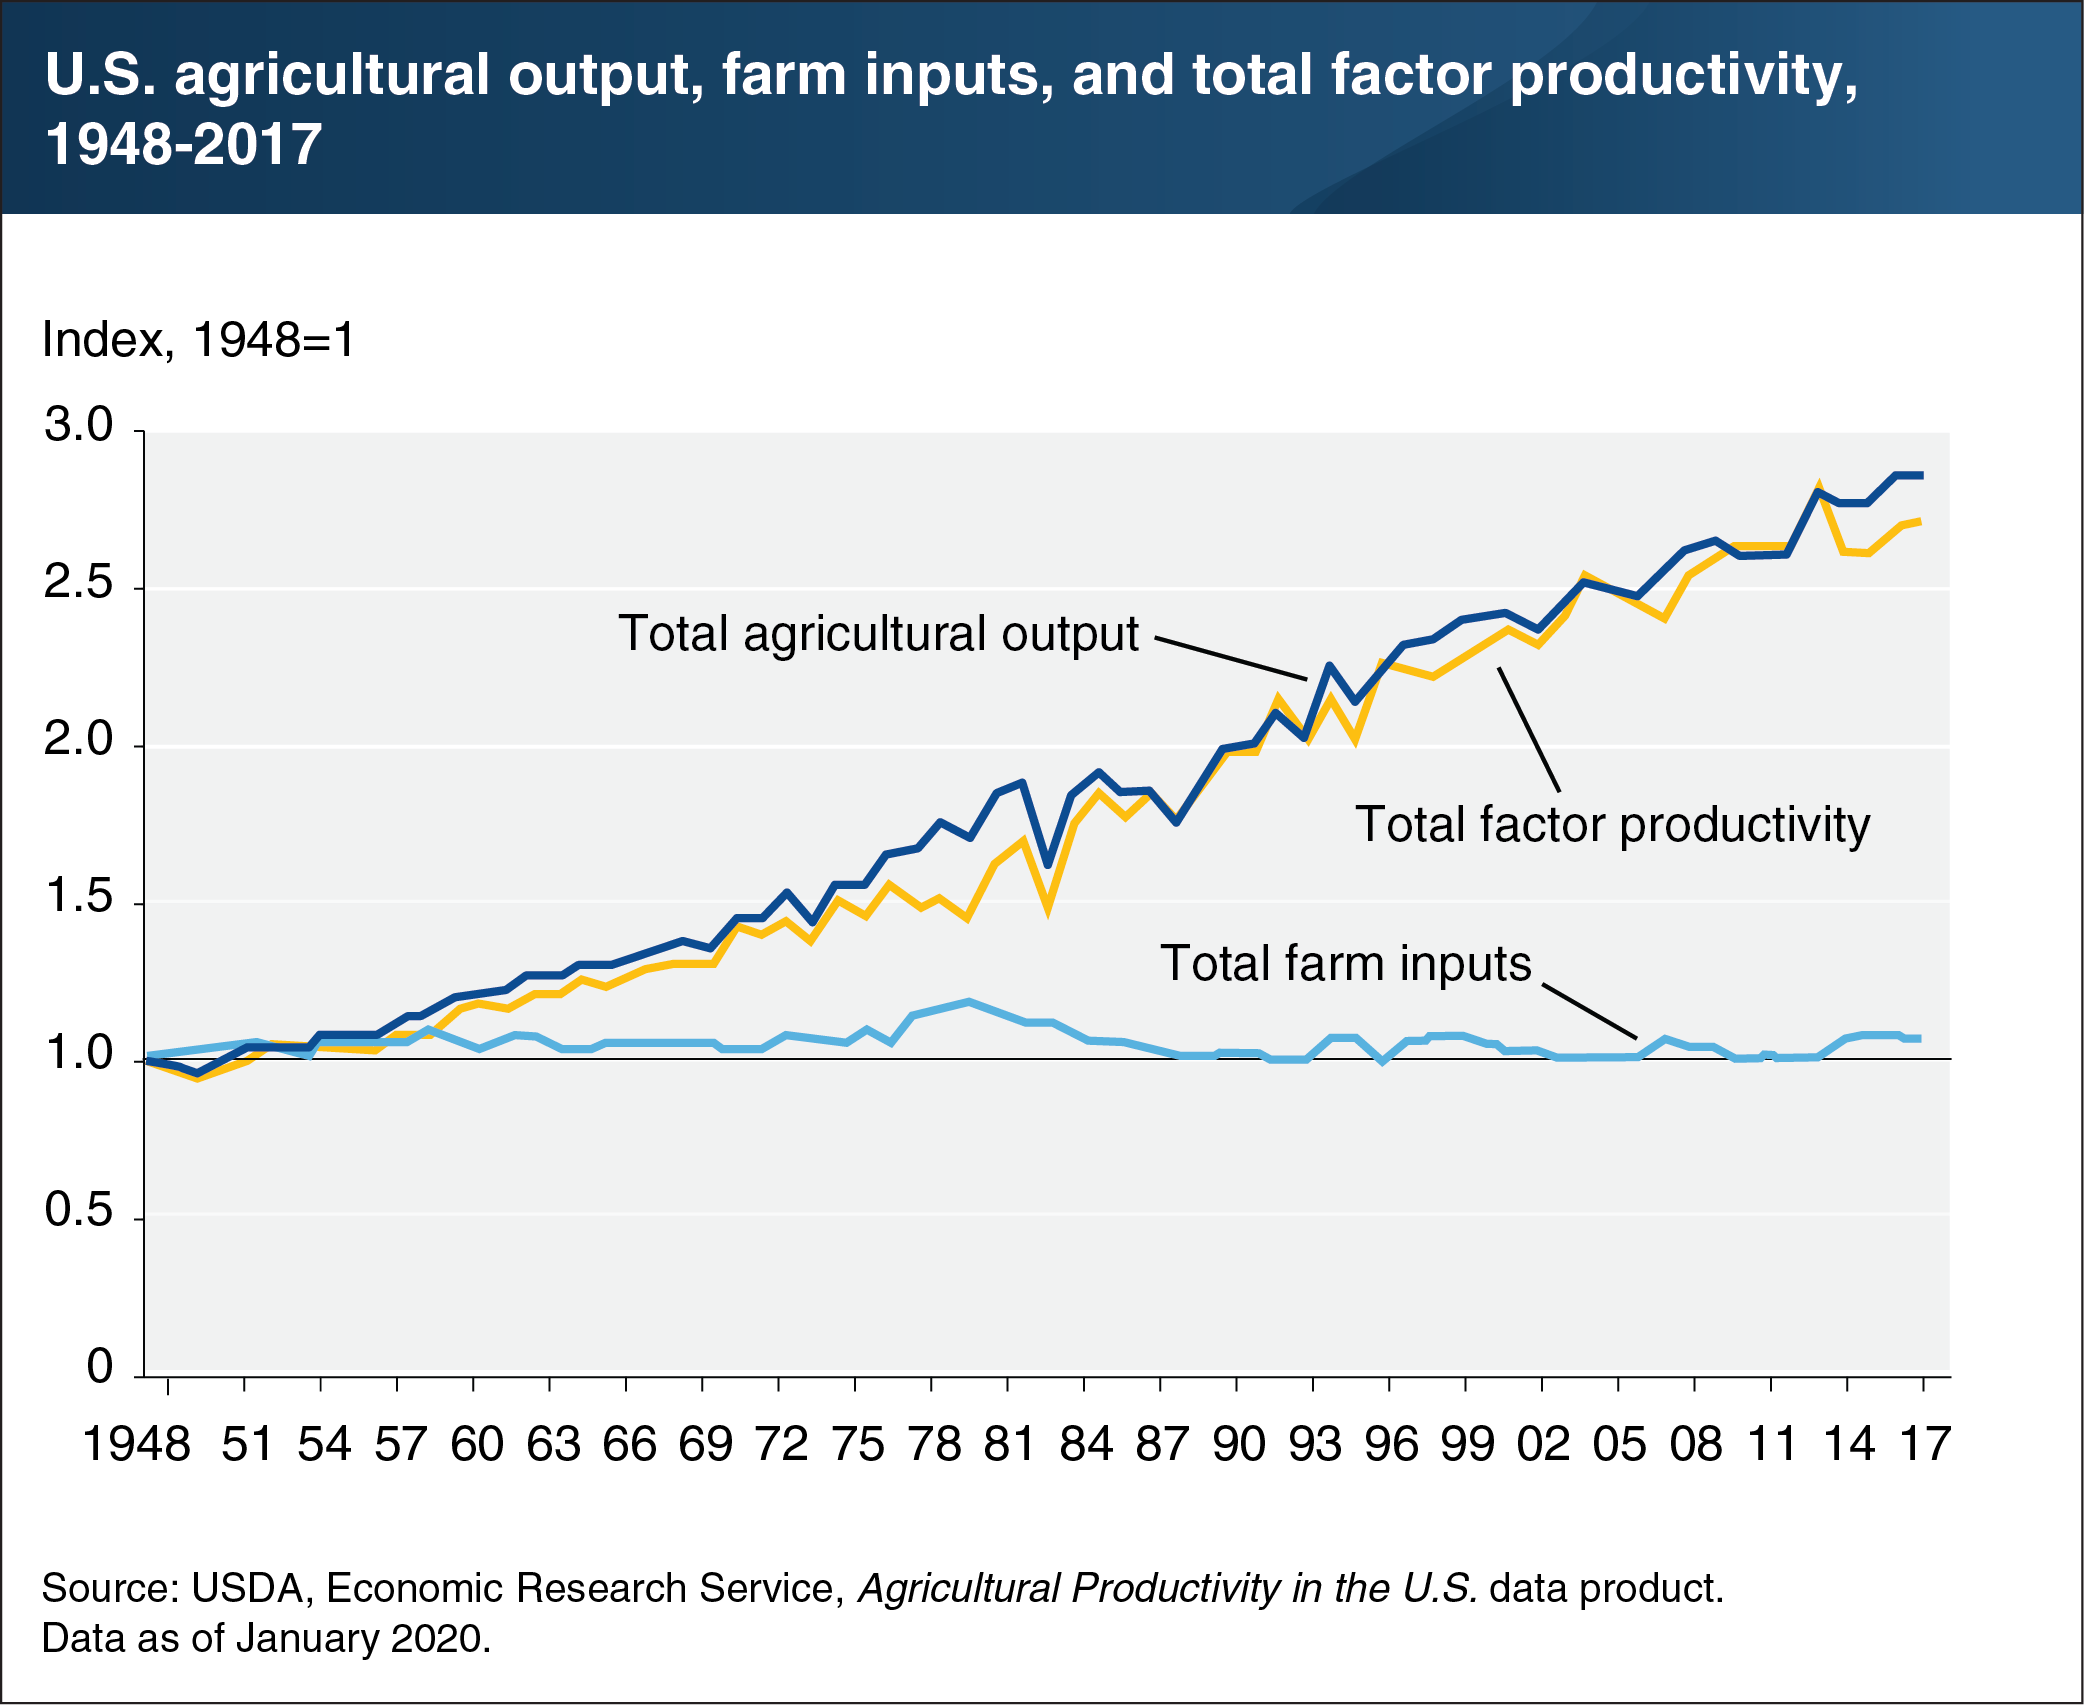
Technological developments in agriculture have been influential in driving changes in the farm sector. Innovations in animal and crop genetics, chemicals, equipment, and farm organization have enabled continuing output growth without adding much to inputs (including land, labor, machinery, and intermediate goods). As a result, even as the amount of land and labor used in farming declined, total farm output nearly tripled between 1948 and 2017. During this period, agricultural output grew at an average annual rate of 1.53 percent, compared to 0.07 percent for total farm inputs. Output growth was largely driven by the growth in agricultural productivity, as measured by total factor productivity (TFP)—the difference between the growth of aggregate output and growth of aggregate inputs. Between 1948 and 2017, TFP grew at an average annual rate of 1.46 percent. In the short term, TFP estimates can fluctuate from time to time—reflecting transitive events, such as bad weather or oil shocks—but it usually recovers and returns to its long-term trend growth, as has happened in recent years. This chart appears in the ERS data product, Agricultural Productivity in the U.S., updated January 2020.