

Rural population gains among Native Americans and Hispanics have offset population losses among Whites and Blacks
- by John Cromartie
- 7/19/2019
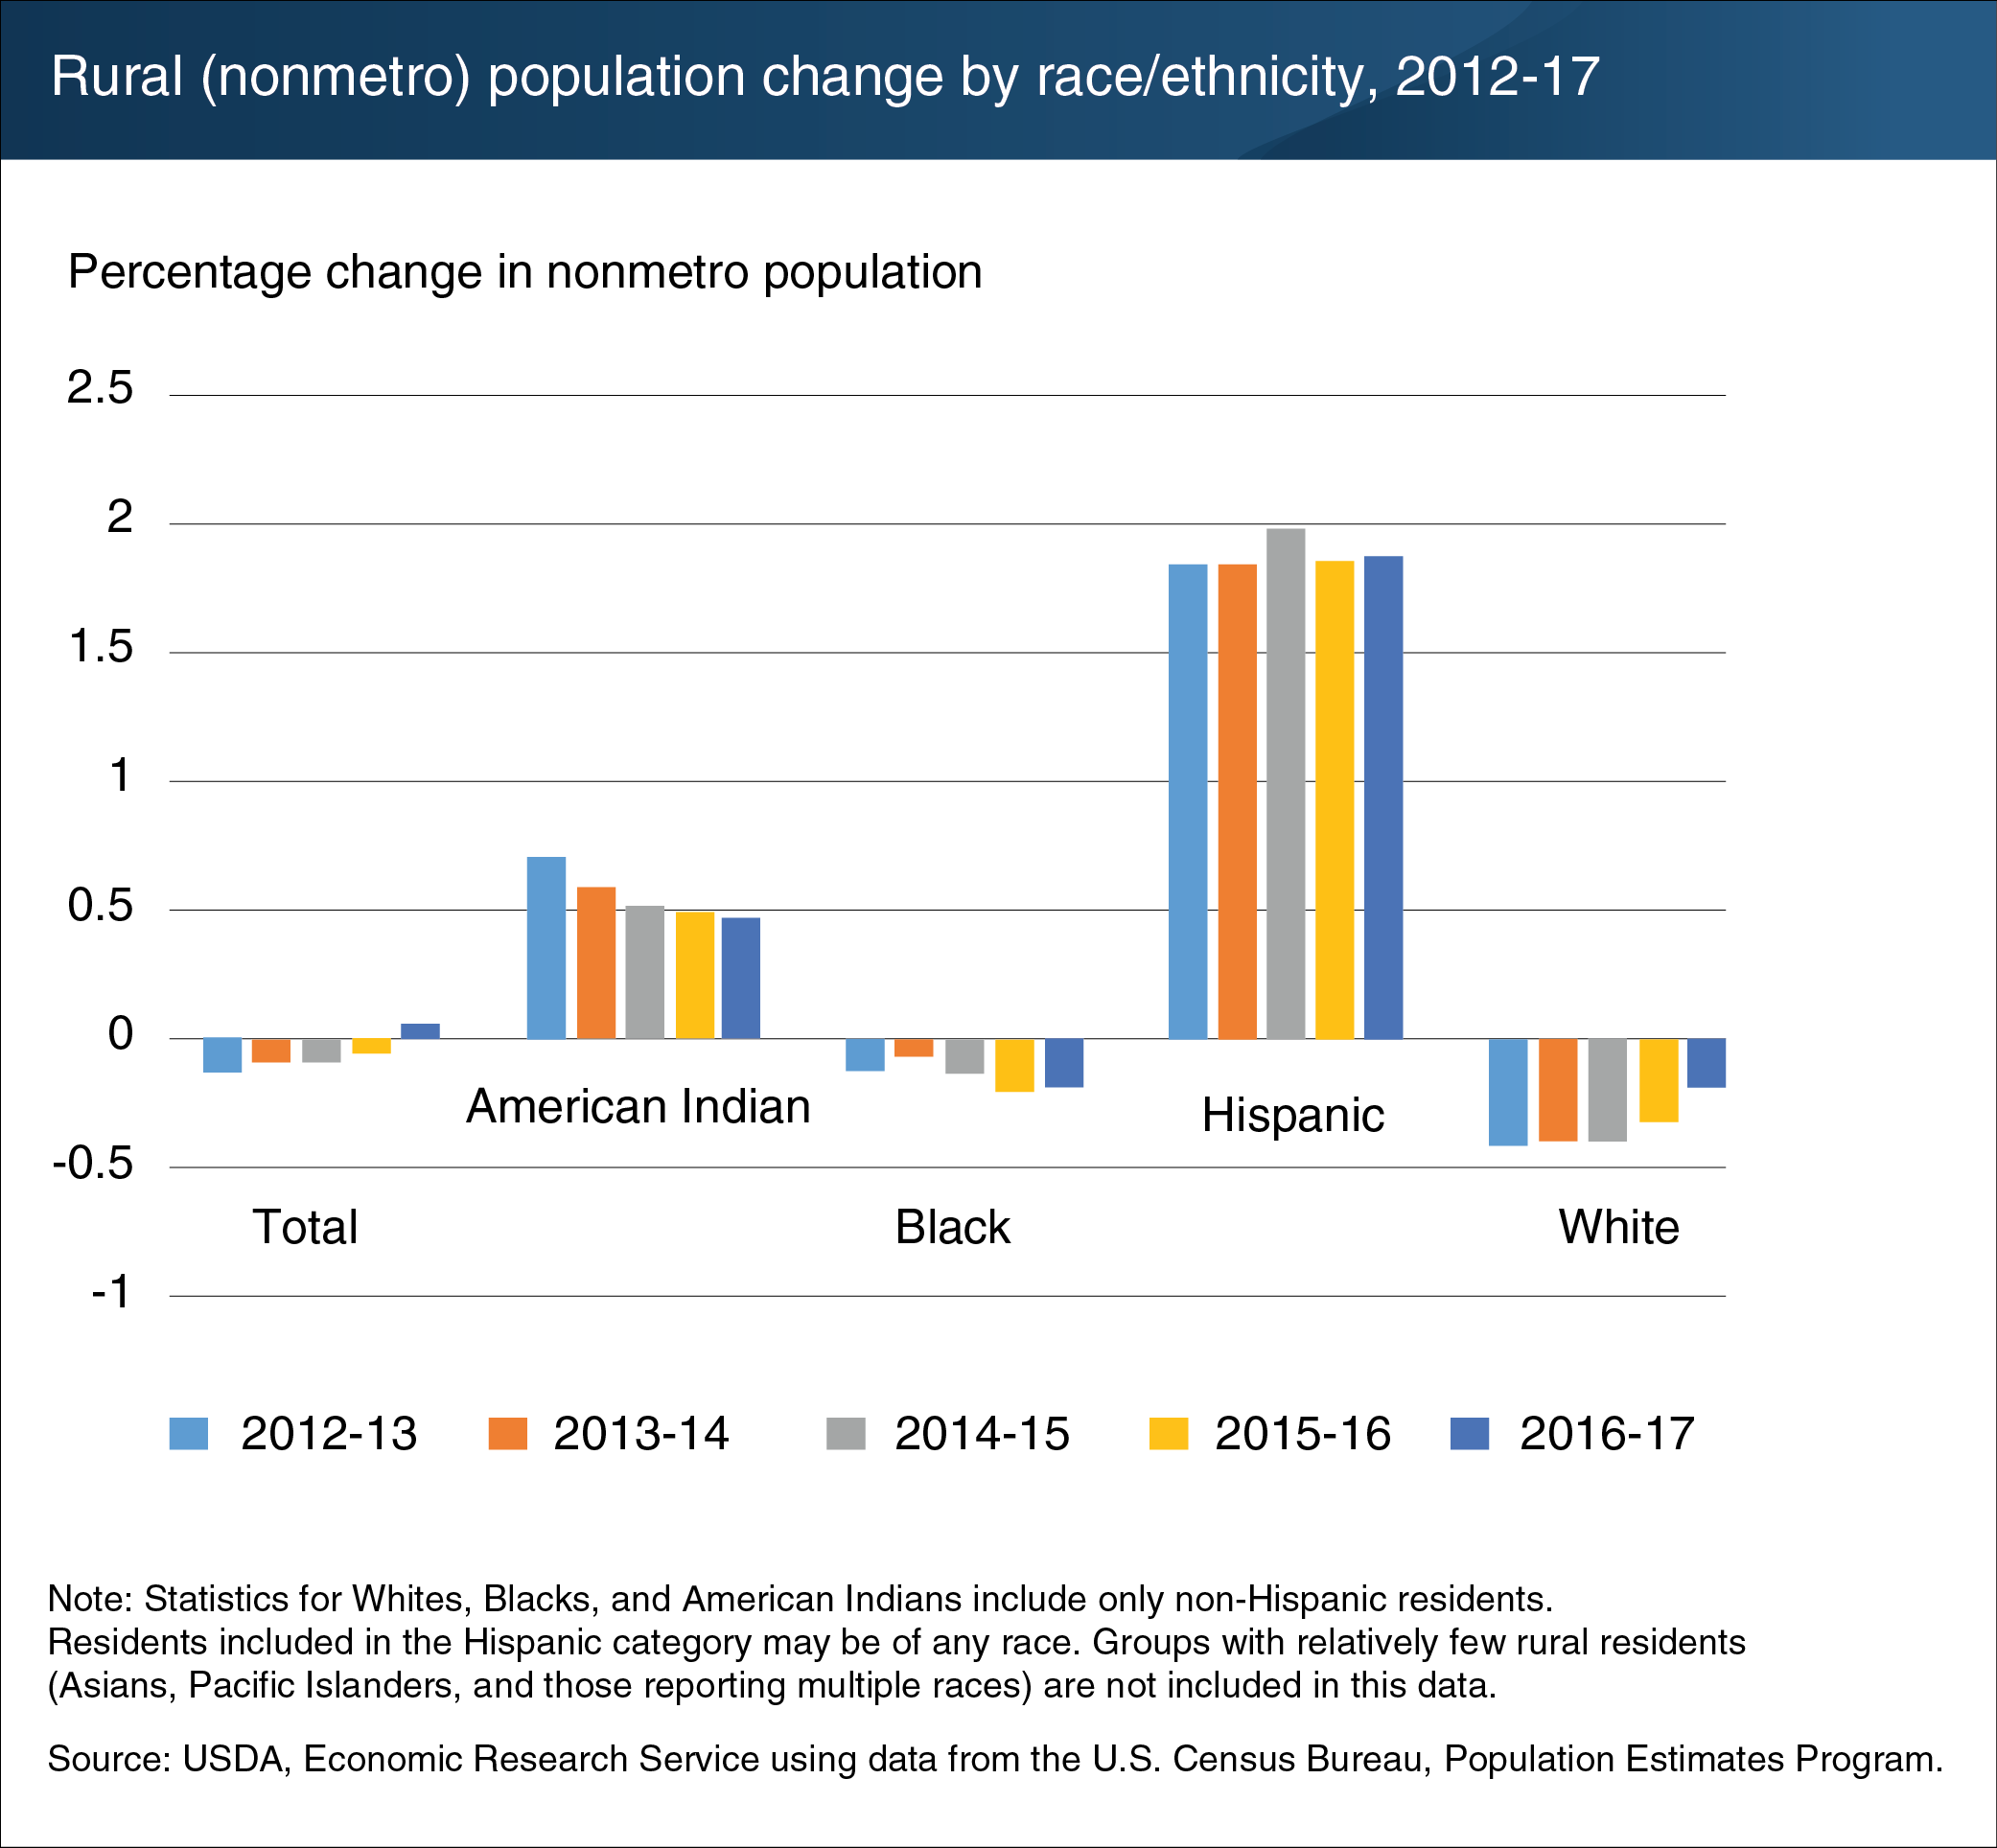
Rural America, with racial/ethnic minorities making up 22 percent of the population in 2016-17, has continued to diversify, but at a slower rate compared to 2012-13. The annual rate of population loss among rural Whites fell from -0.44 to -0.20 percent between 2012-13 and 2016-17. This change is likely due to changes in net migration, with fewer Whites moving out and more moving into rural areas in 2016-17 compared with 2012-13. The rural Black population continued to lose population in 2016-17 as well, but at a higher rate of loss than earlier (-0.20 versus -0.14 percent in 2012-13). Population gains among American Indians and Hispanics have offset population losses among Whites and Blacks. American Indians increased their rural population throughout the period but at diminishing rates, while the Hispanic rate of growth remained near 2 percent per year throughout the period. Although Hispanics are the fastest growing segment of the rural population, they accounted for just 9 percent of the rural population in 2017 (compared to 80 percent for Whites). This chart appears in the November 2018 ERS report Rural America at a Glance, 2018 Edition.