
Improving rural net migration rates were most common in recreation and retirement destinations
- by John Cromartie
- 3/8/2019
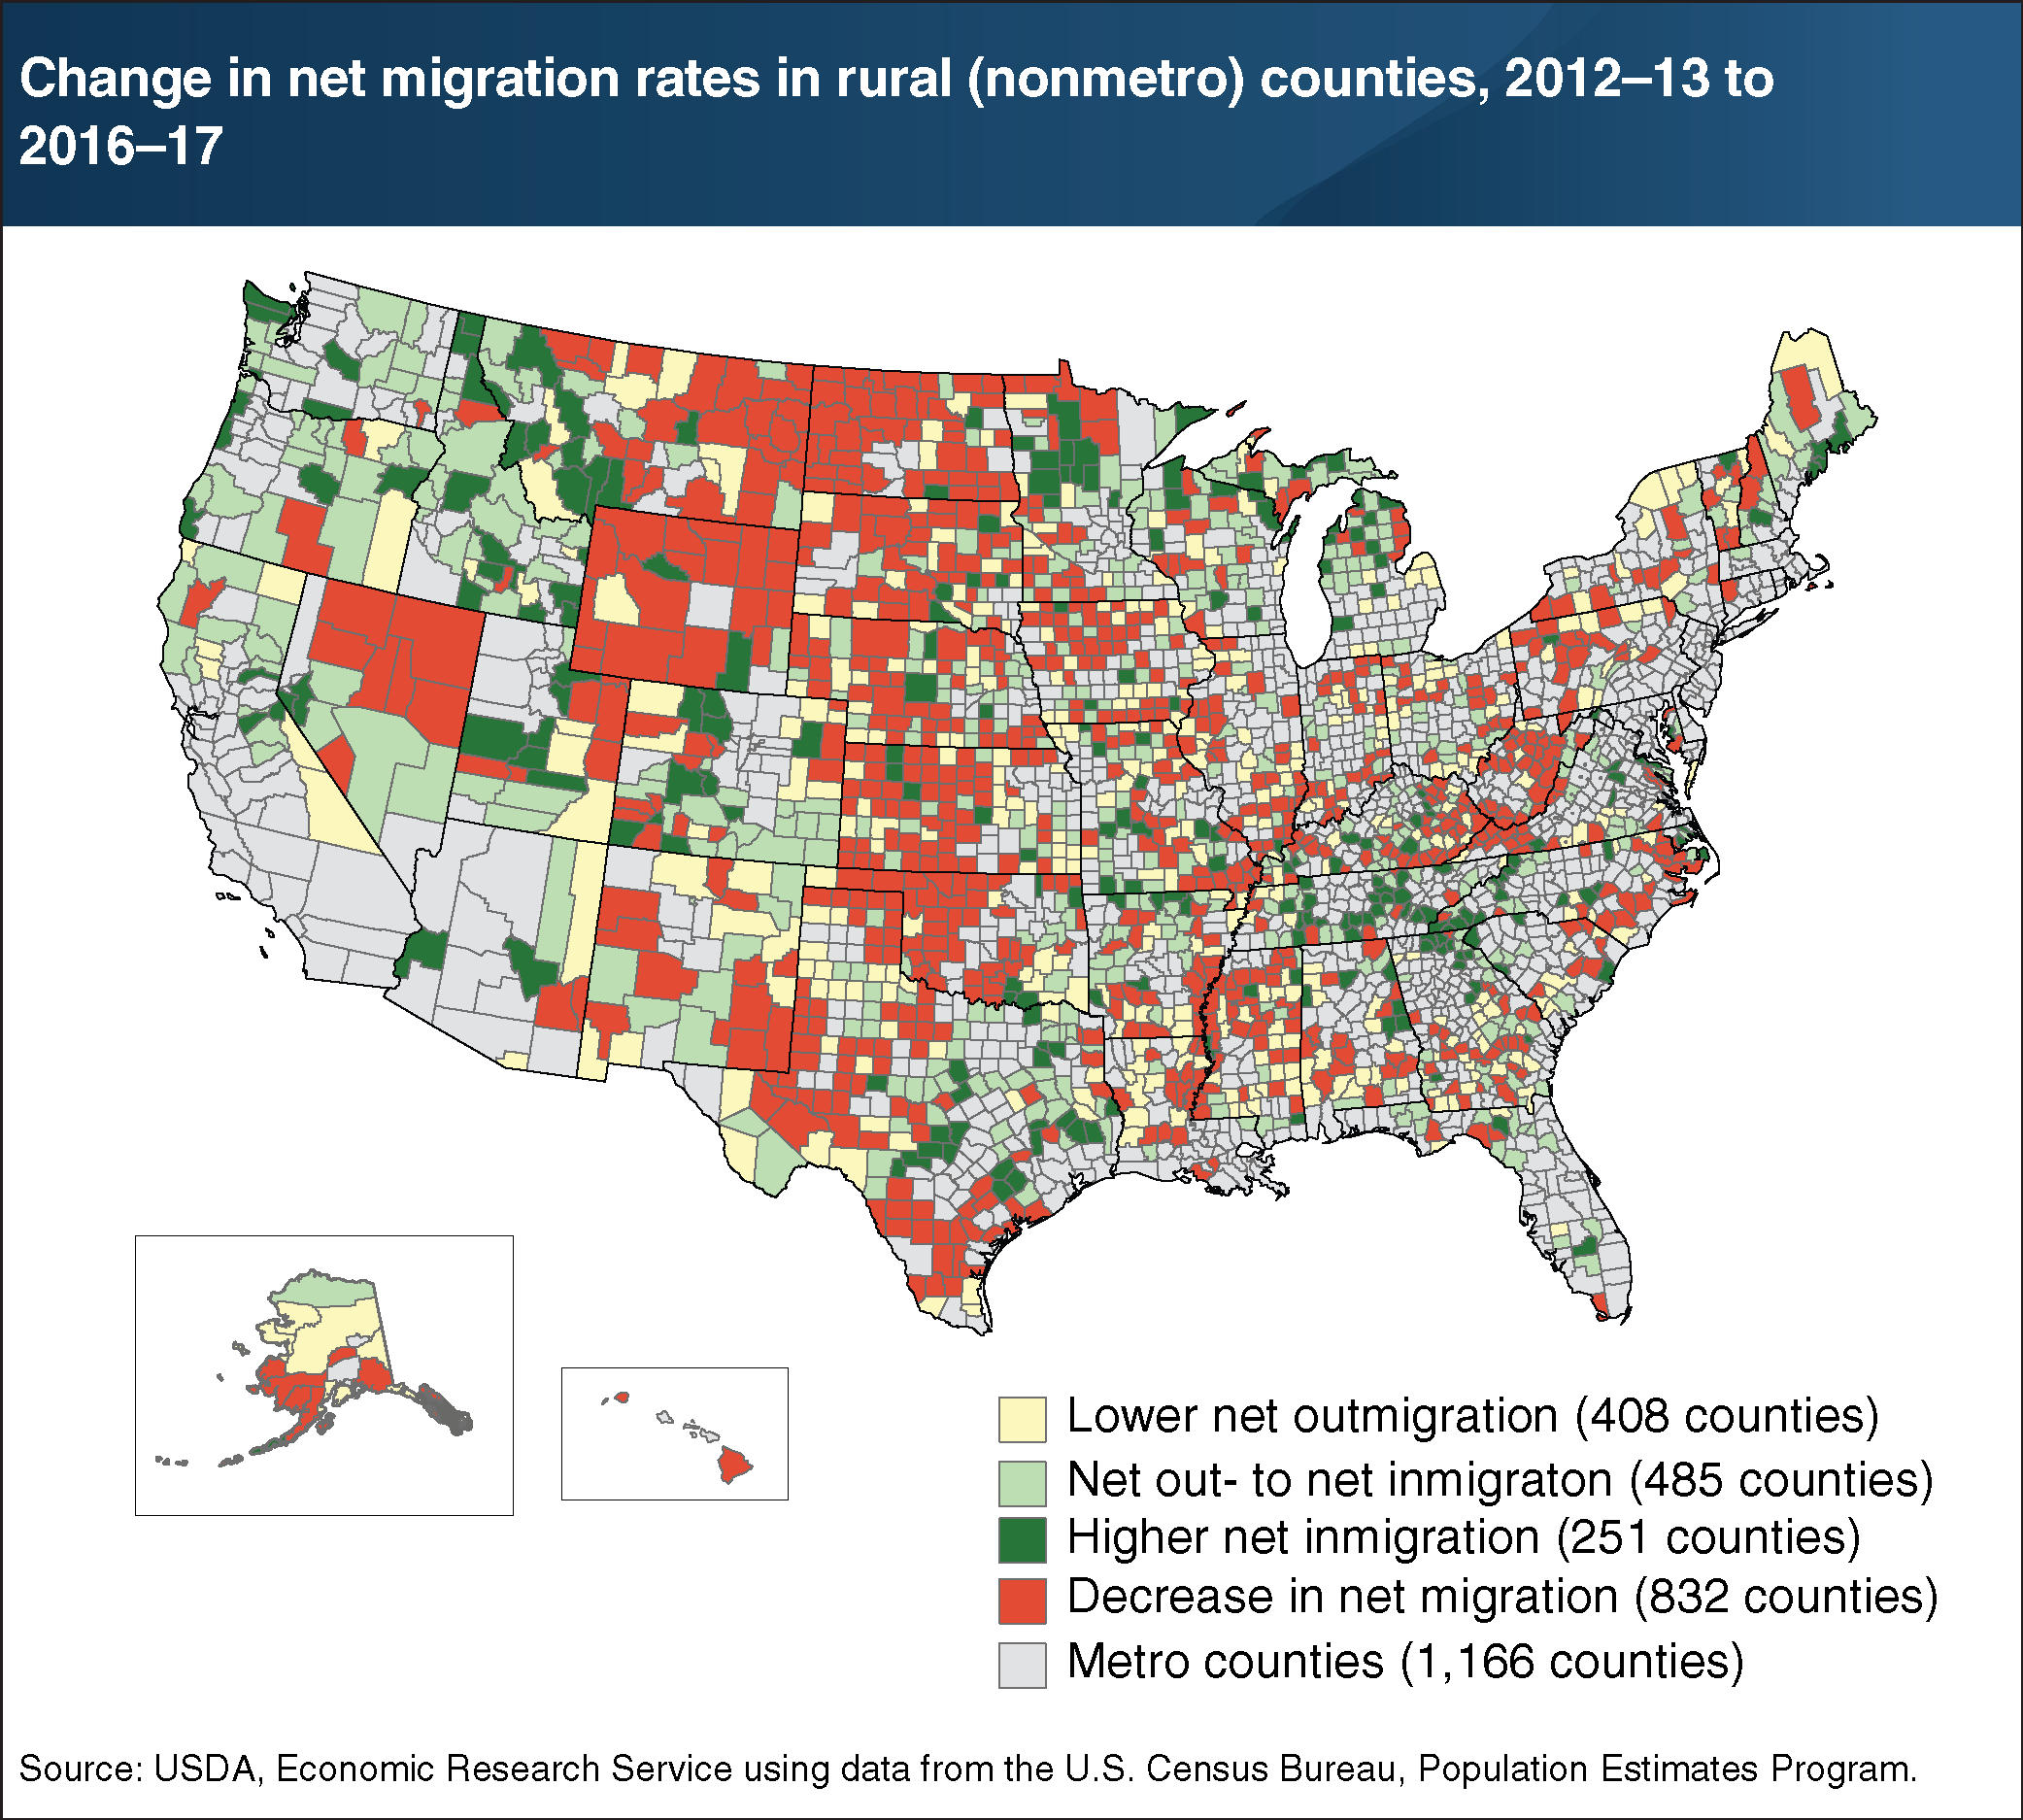
People moving to rural areas tend to favor more densely settled areas with attractive scenic qualities, or those near large cities. Over 1,100 rural counties (58 percent) showed positive changes in net migration (inmigrants minus outmigrants) between 2012–13 and 2016–17. These counties are often located in recreation and retirement destinations attractive to newcomers—such as the Upper Great Lakes, the Pacific Northwest, the southern Appalachians, Florida, and the Hill Country of central Texas. Nearly 500 of these counties switched from net outmigration in 2012–13 to net inmigration in 2016–17. Fewer people are moving to sparsely settled, less scenic, and remote locations, which compounds economic development challenges in those areas. Despite increasing net migration generally, 42 percent of rural counties experienced a decrease in net migration between 2012–13 and 2016–17. These counties are in low-density, remote areas in the Nation’s Heartland, in Appalachia from eastern Kentucky to Maine, and in high-poverty areas in the Southeast and border areas of the Southwest. Some of these areas have suffered job losses related to lower oil and gas production. This chart appears in the November 2018 ERS report Rural America at a Glance, 2018 Edition.
We’d welcome your feedback!
Would you be willing to answer a few quick questions about your experience?