
In recent years, population has declined in rural areas
- by John Cromartie
- 9/7/2017
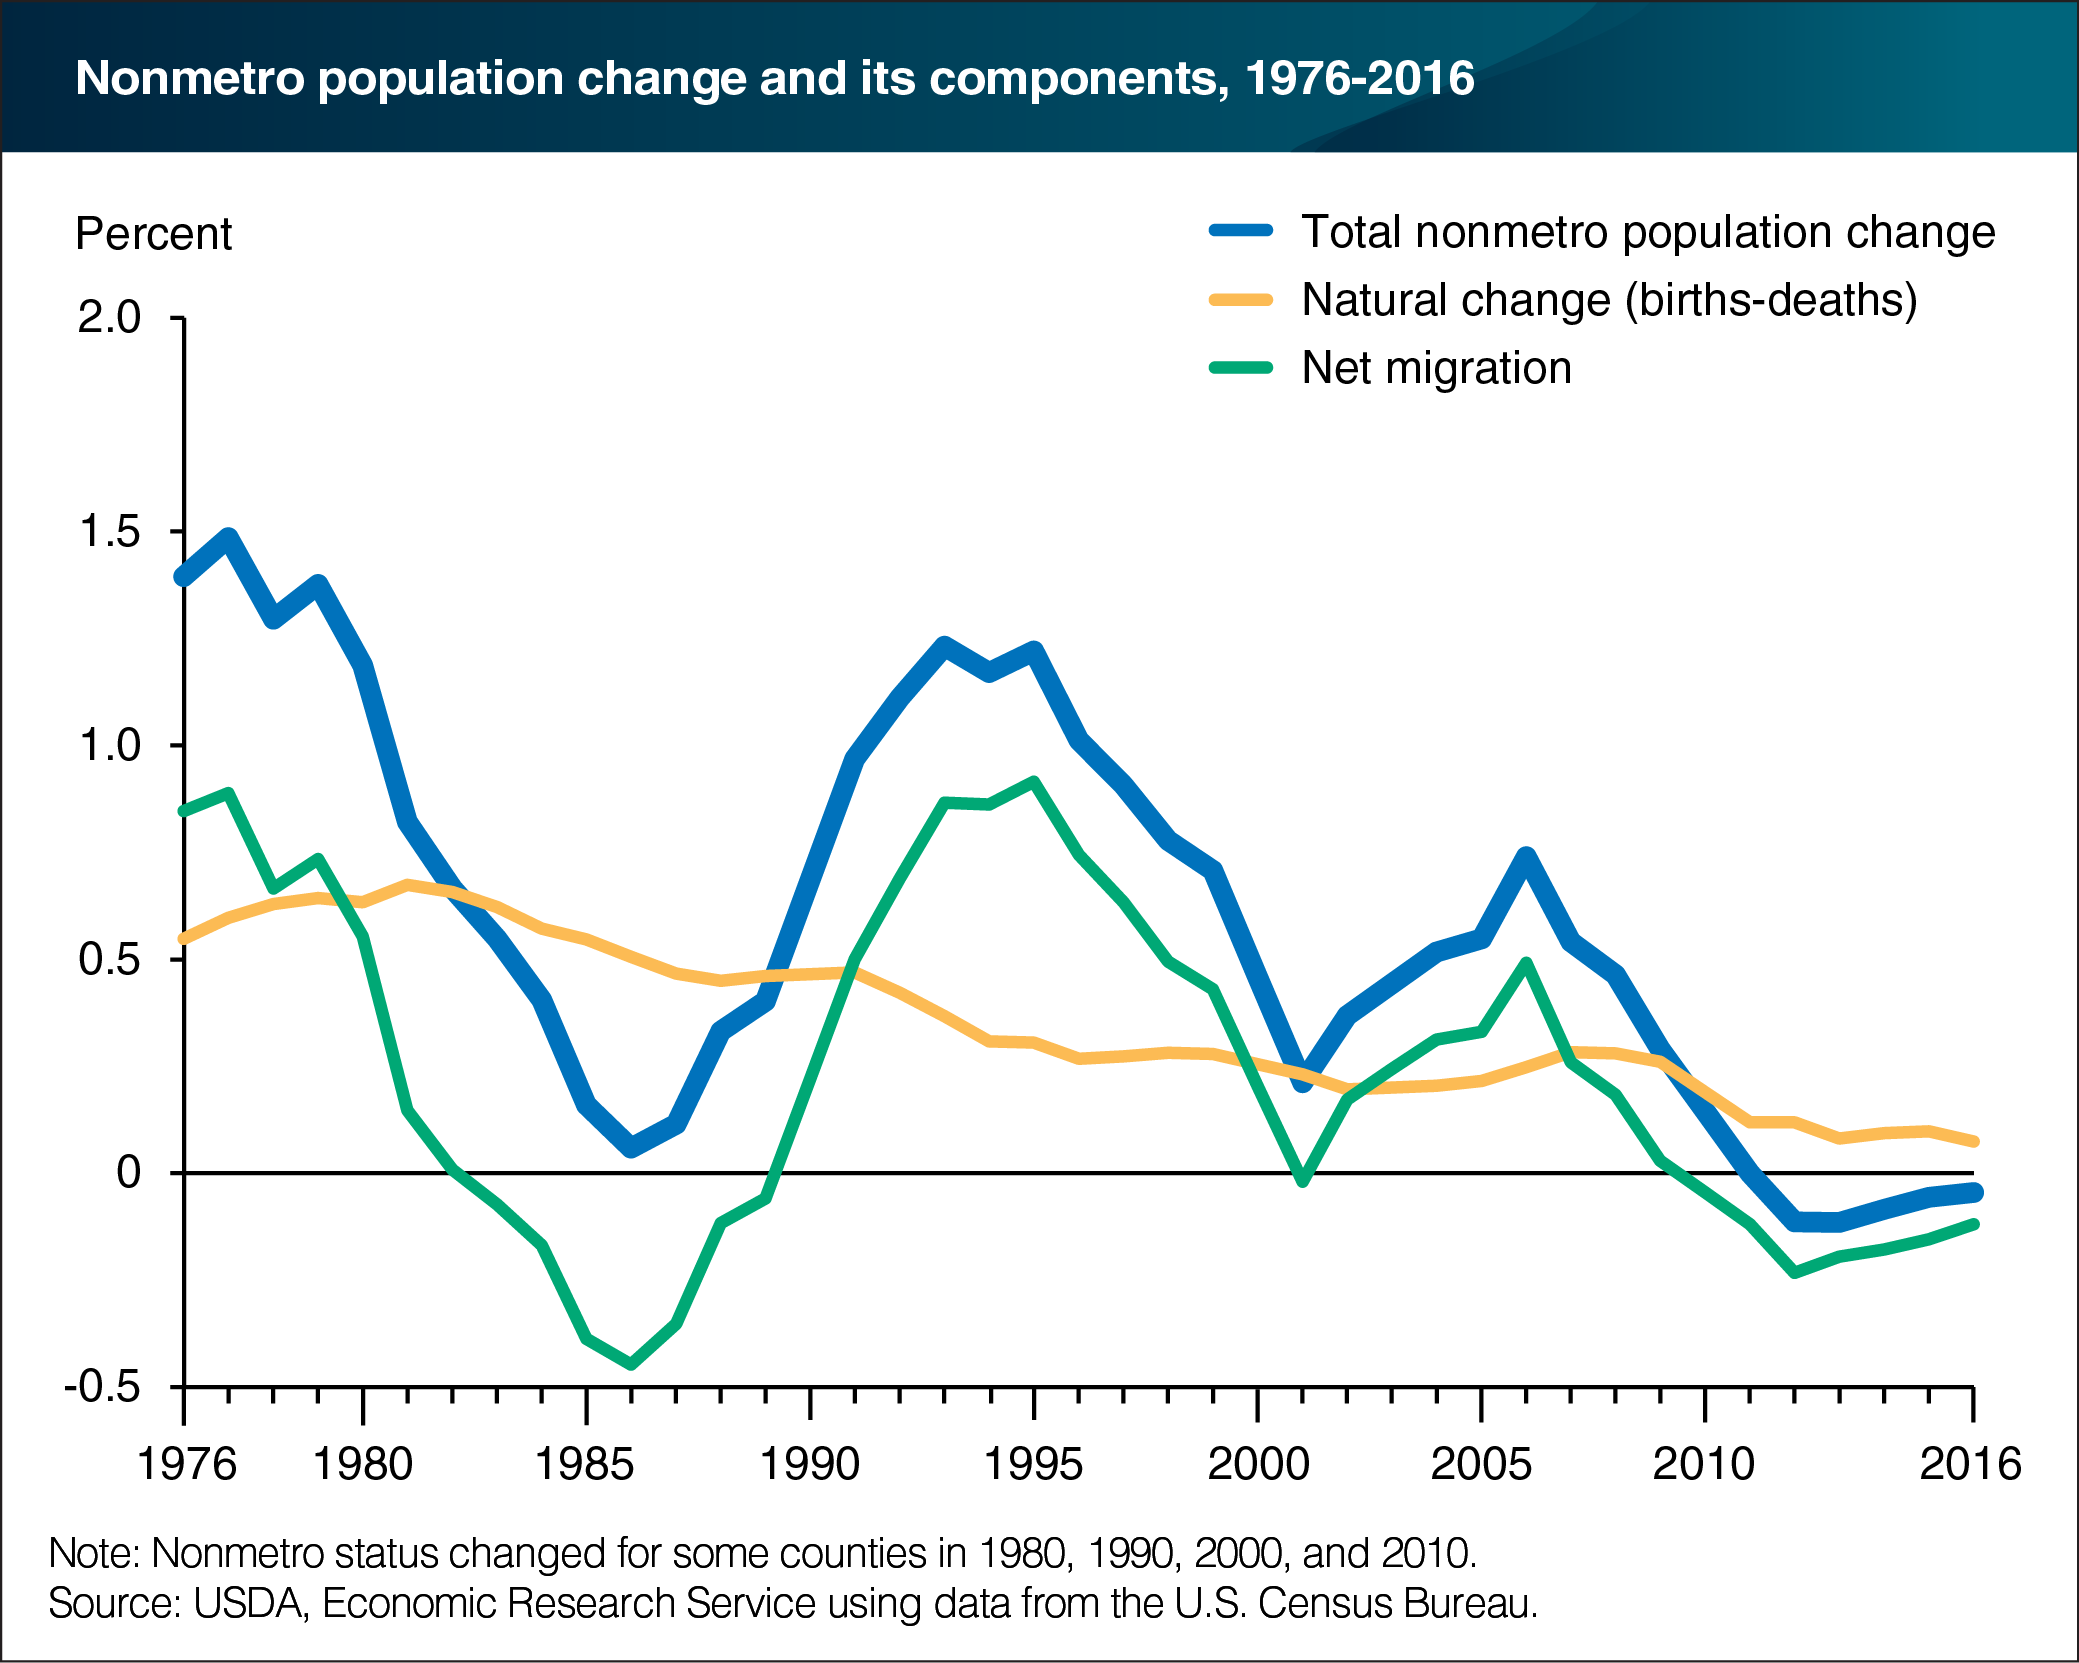
Population change includes two major components: natural change (births minus deaths) and net migration (in-migrants minus out-migrants). While natural change has gradually trended downward over time, net migration rates tend to fluctuate in response to economic conditions. Population growth from natural change (more births than deaths, also known as natural increase) was the norm historically. Between 2010 and 2016, however, the increase in rural population from natural change (270,000 more births than deaths) has not kept pace with the decrease in population from net migration (462,000 more people moved out than moved in). Declining birth rates, increasing mortality rates among working-age adults, and an aging population have led to the emergence of natural decrease (more deaths than births) in hundreds of U.S. counties—most of them rural. This chart appears in the September 2017 Amber Waves data feature, "Rural Areas Show Overall Population Decline and Shifting Regional Patterns of Population Change."
We’d welcome your feedback!
Would you be willing to answer a few quick questions about your experience?