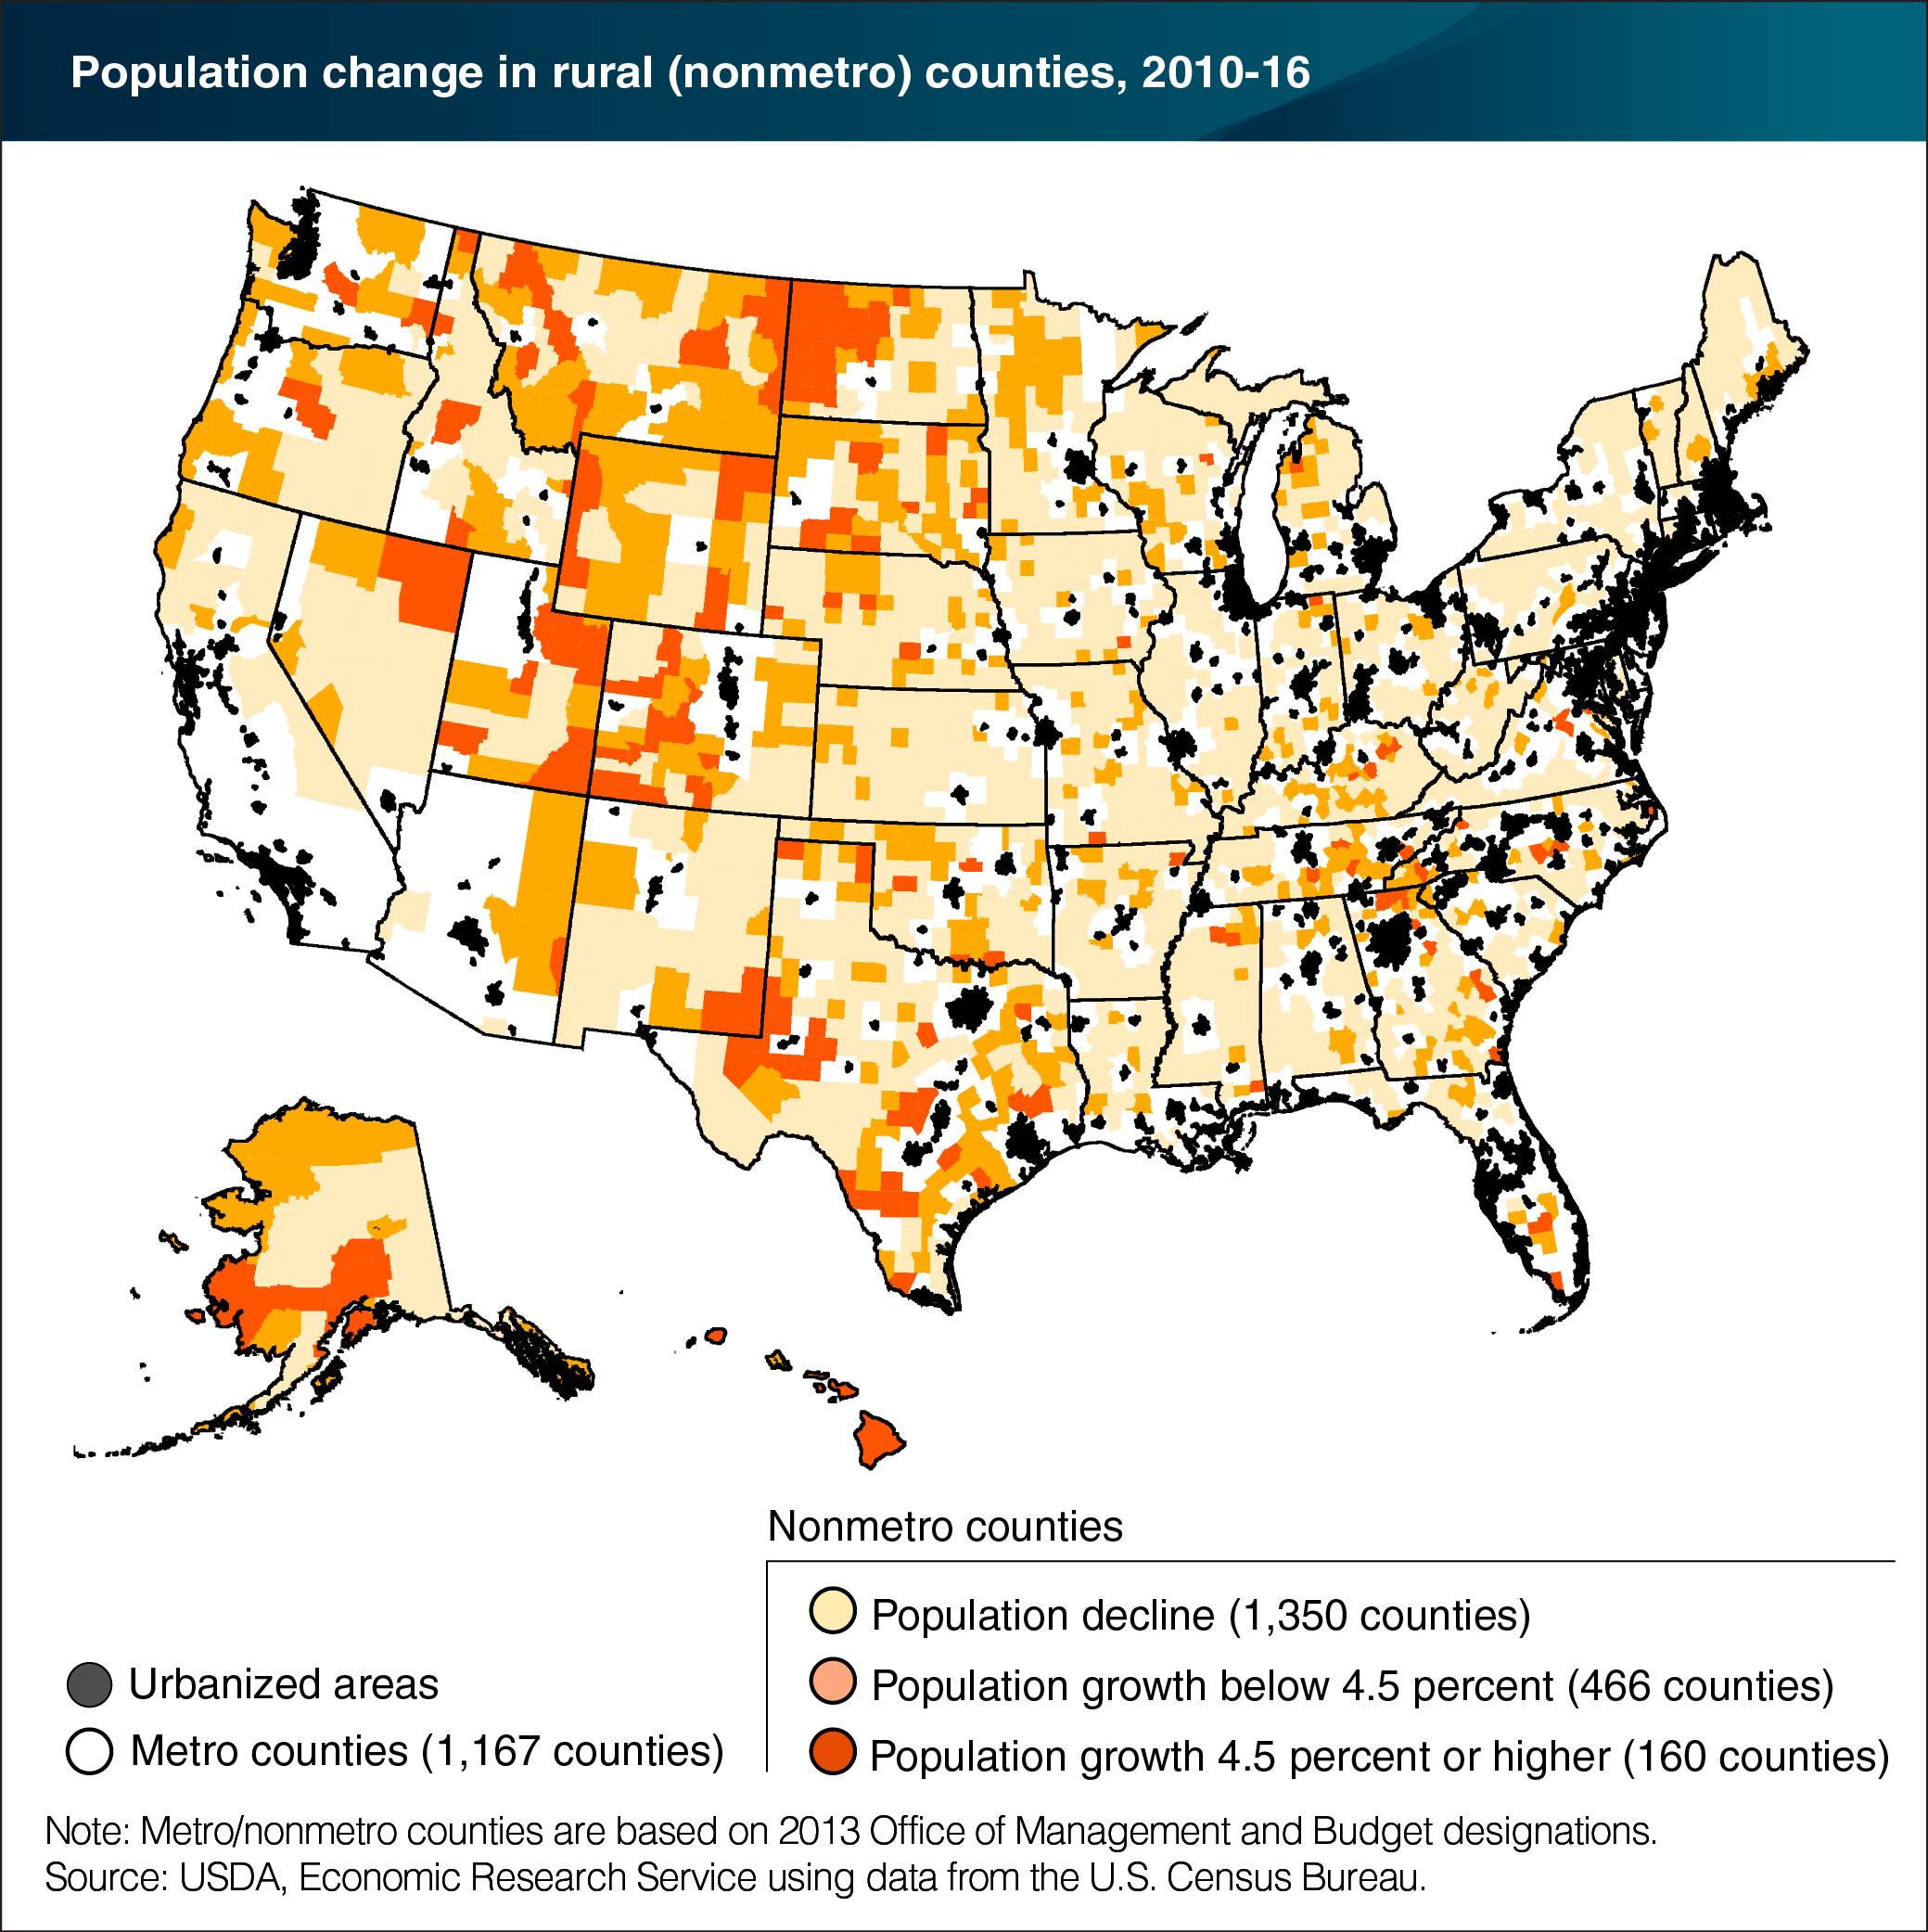
Rural population change varies across the United States
- by John Cromartie
- 6/28/2017

The number of people living in rural (nonmetro) counties stood at 46.1 million in July 2016, representing 14 percent of U.S. residents. Population in rural counties continued to decline slightly for a sixth straight year in 2015-16, according to the Census Bureau’s latest estimates. Rural population loss has been relatively small—192,000 fewer people in 2016 compared with 2010, a decline of just 0.4 percent. However, this overall trend masks substantial regional and local variation. Population declined by 790,000 people in the 1,350 rural counties that lost population since 2010. Extensive population-loss regions are evident throughout the Eastern United States. On the other hand, 466 rural counties grew at moderate rates (below the national average of 4.5 percent) and added 245,000 people. Many of these counties are located in recreation or retirement destinations, such as in the Intermountain West or southern Appalachia. The remaining 160 rural counties that increased at rates above 4.5 percent added 353,000 people. The highest rates of growth during 2010-16 occurred in rural counties with booming energy sectors, such as those centered in western North Dakota’s Williston Basin. However, these counties experienced a considerable population slowdown in 2015-16, in line with declines in oil and gas production. This chart appears in the ERS topic page for Population & Migration, updated June 2017.
We’d welcome your feedback!
Would you be willing to answer a few quick questions about your experience?

