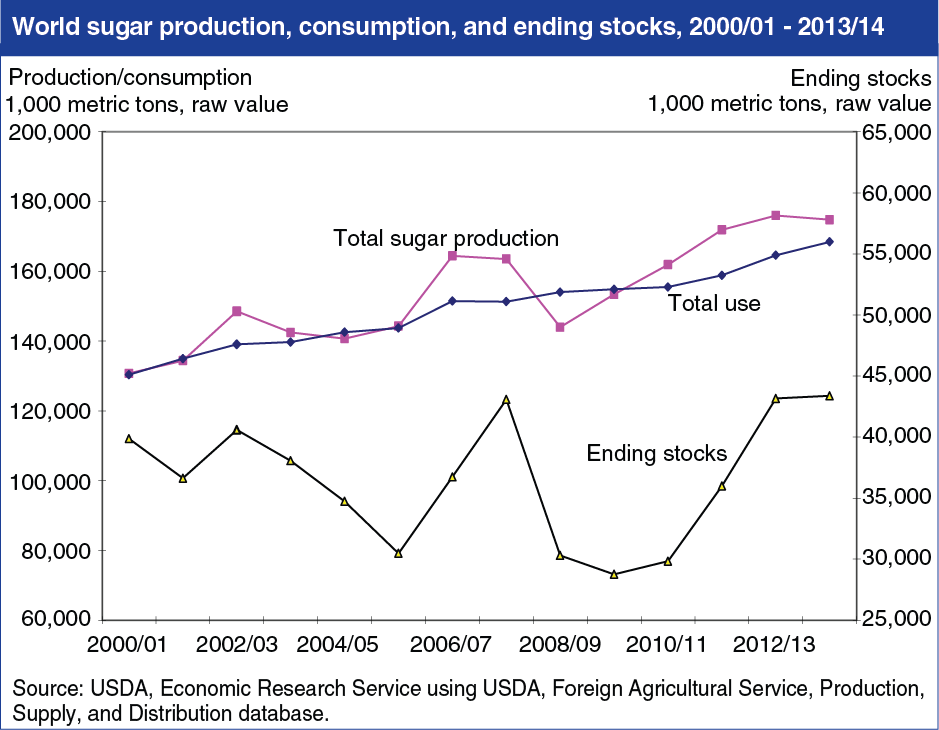
Outlook for 4th consecutive year of surplus global sugar production
- by Stephen Haley
- 1/3/2014

Since the 2010/11 marketing year, surplus global sugar production—the difference between total world production and total use—has led to the accumulation of stocks and downward pressure on world sugar prices. The global surplus is forecast to be smaller in 2013/14, as lower world prices in 2012/13 contribute to slightly lower production and greater consumption in 2013/14, however stocks are forecast to remain relatively high. India and China are the main sources of increased stocks, both in tonnage and in terms of percentage change; stock accumulation has also been significant in the European Union and Thailand. With stocks relative to use remaining above average, world sugar prices are forecast to be lower than levels seen in recent years. The U.S. sugar sector has gained significant support from high world prices until this past year and, although U.S. policies will limit domestic impacts, the outlook for lower world prices will have implications for U.S. producers and processors and USDA programs that provide domestic price support. This chart can be found in Sugar and Sweeteners Outlook: December 2013.


