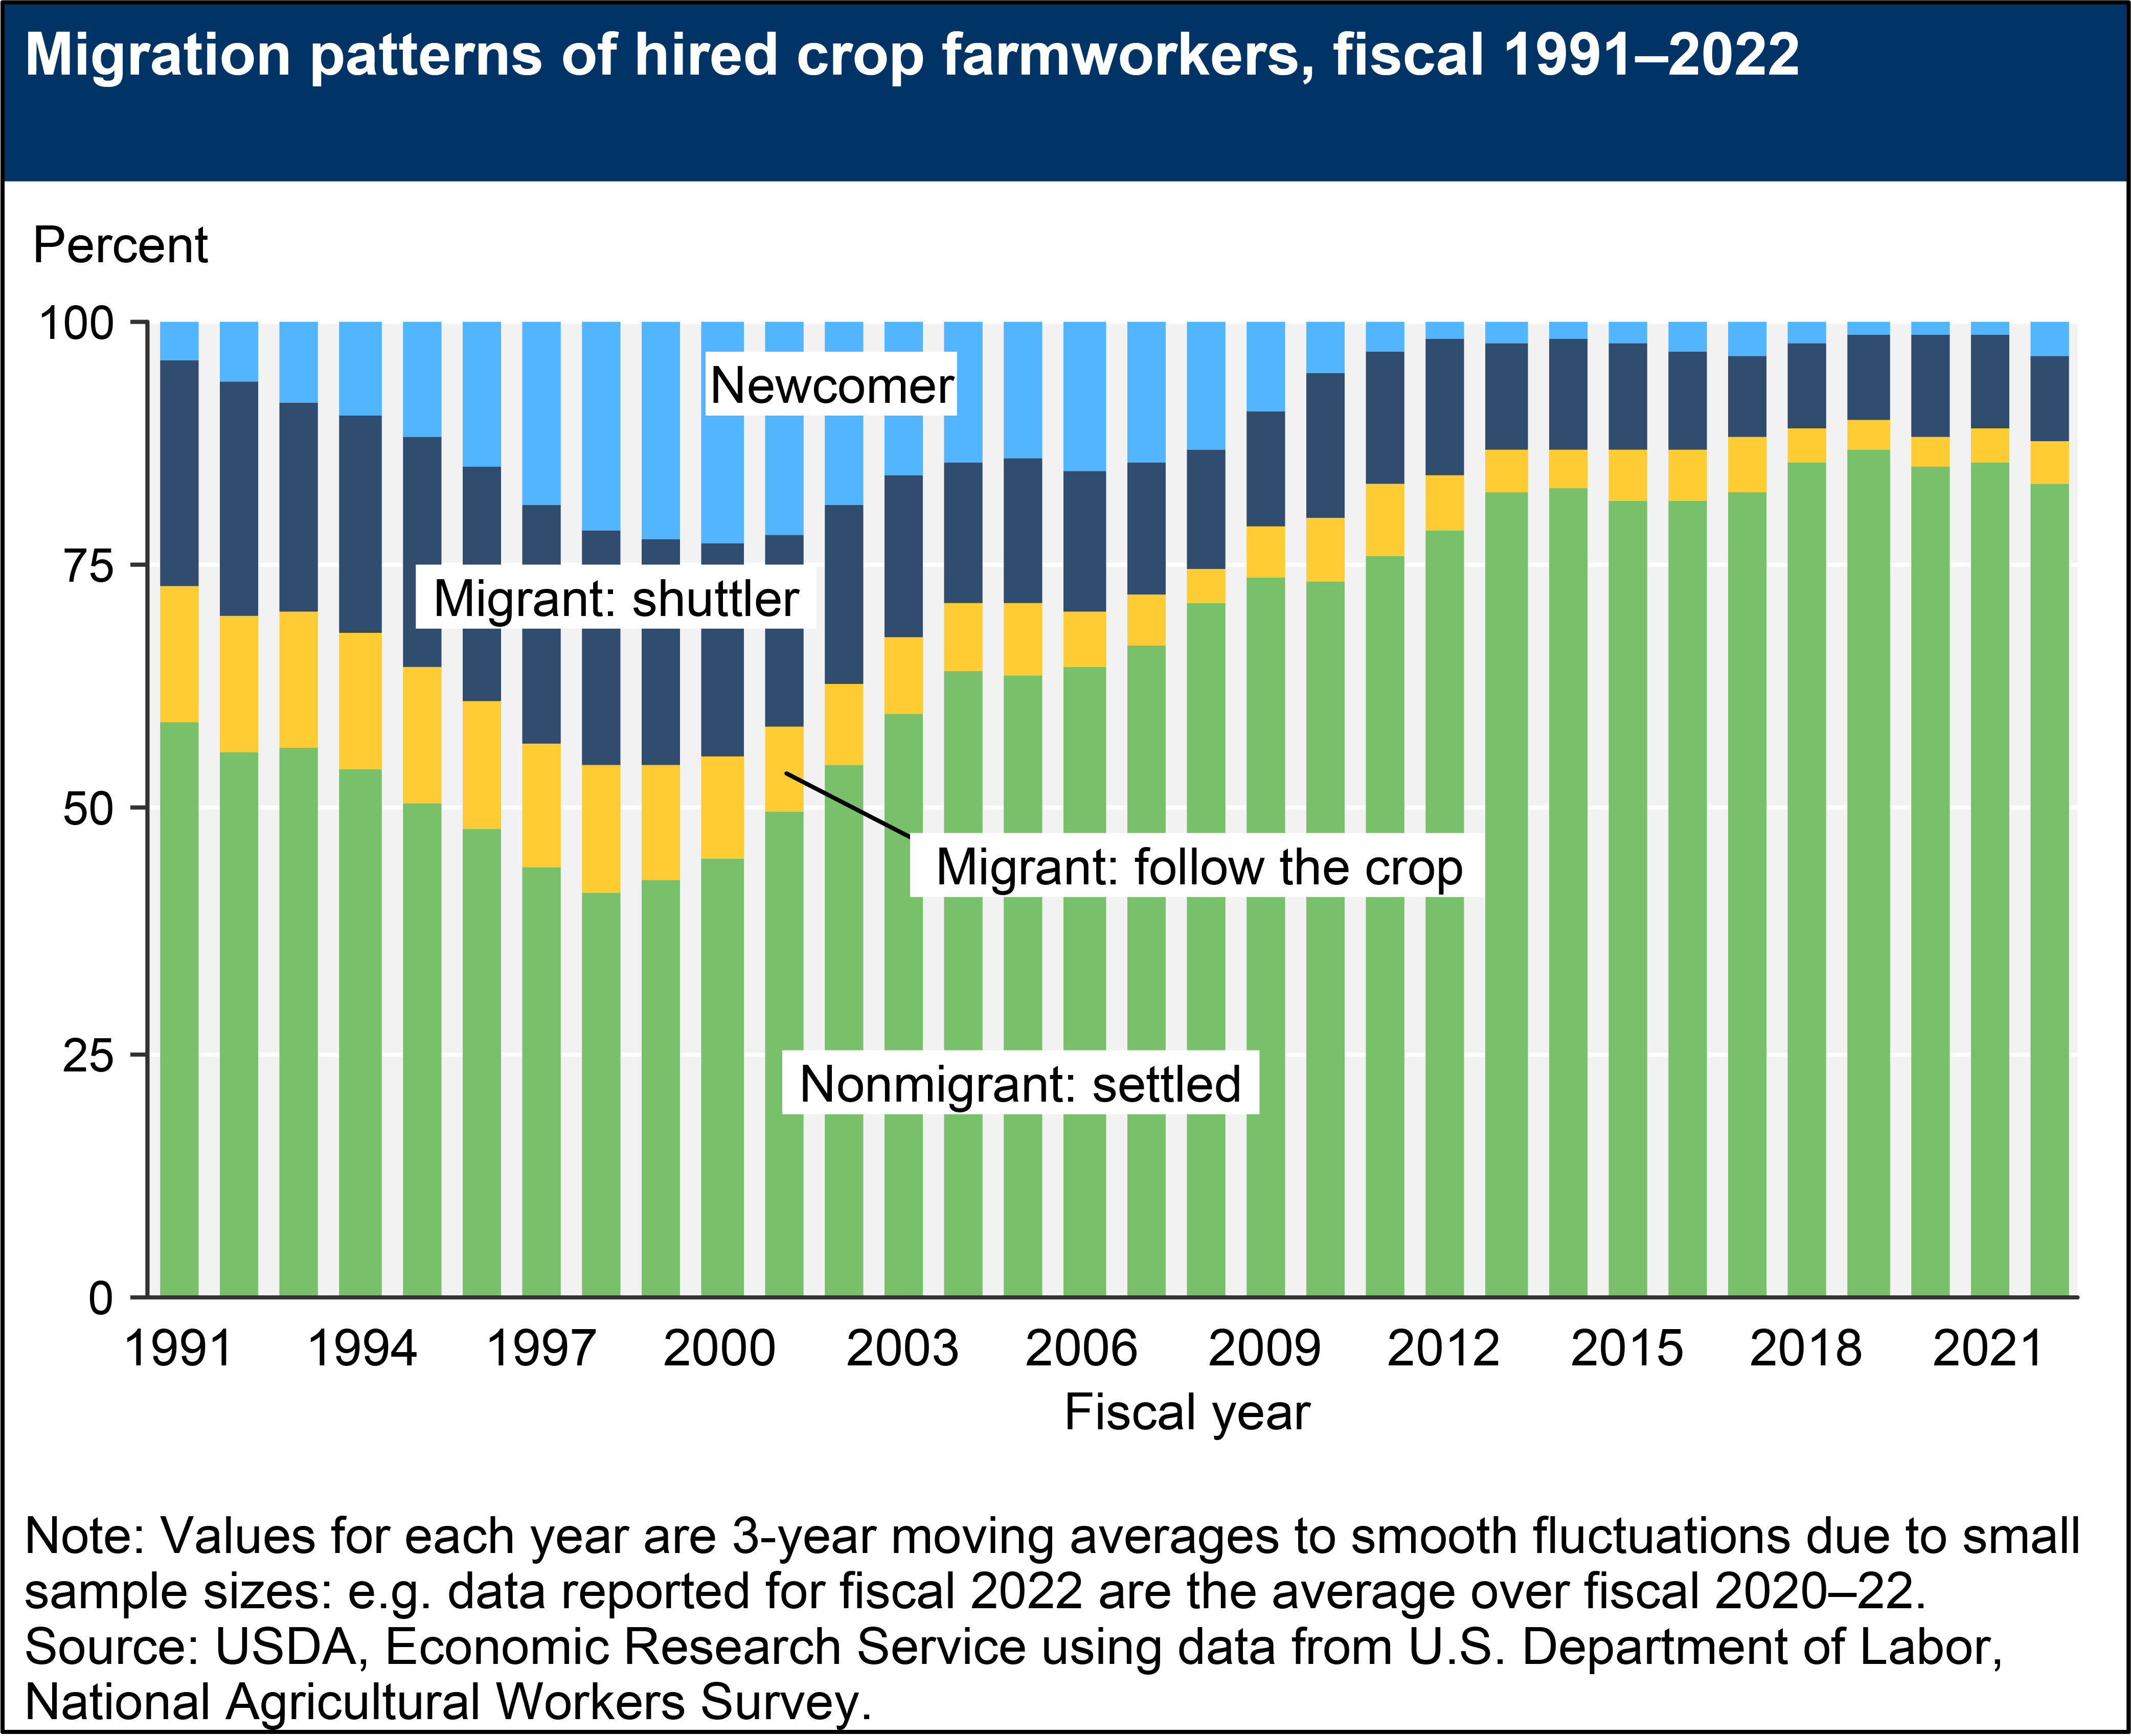
Migration patterns of hired crop farmworkers, fiscal 1991–2022
- by Marcelo Castillo
- 11/21/2024

Download chart image | Chart data
Eighty three percent of hired crop farmworkers are not migrant workers but are considered settled, meaning that they work at a single location within 75 miles of their home. This share is up from 41 percent in 1996–98, reflecting a profound change in the nature of the crop farm workforce.
