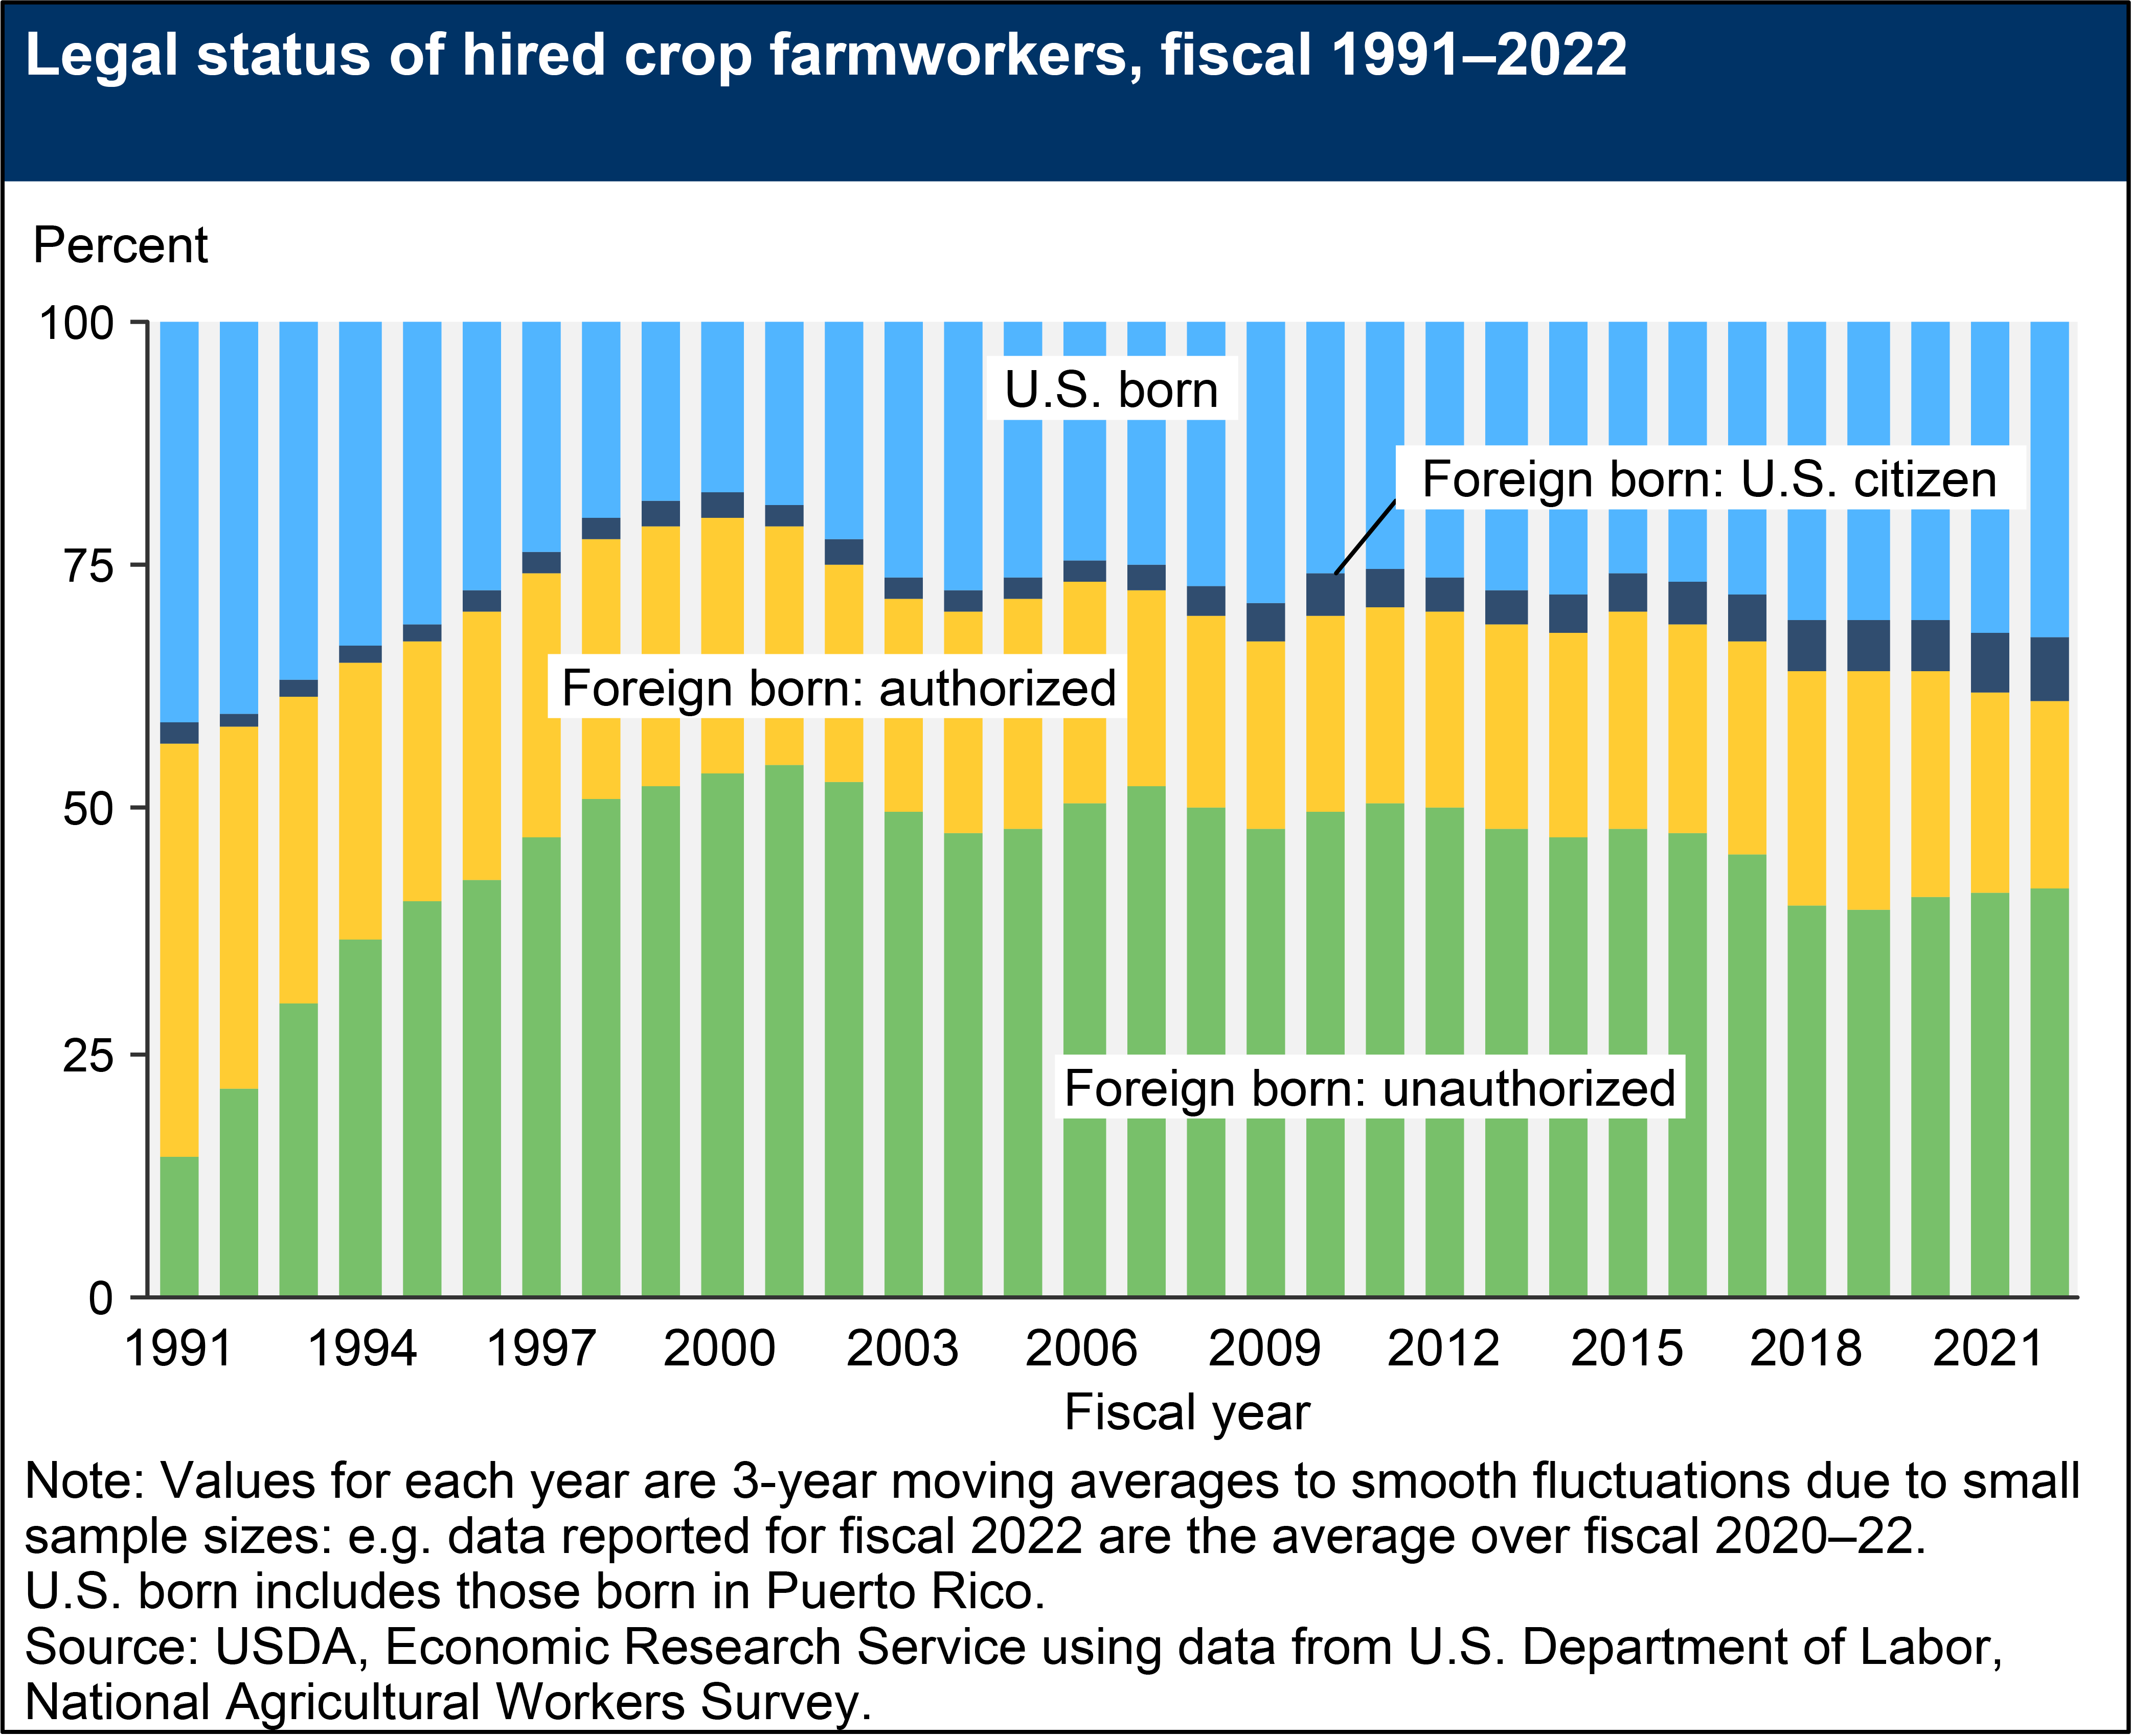
Legal status of hired crop farmworkers, fiscal 1991–2022
- by Marcelo Castillo
- 11/21/2024

Download chart image | Chart data
The share of hired crop farmworkers who were not legally authorized to work in the United States grew from roughly 14 percent in 1989–91 to almost 55 percent in 1999–2001; in recent years it has declined to about 40 percent. In 2020–22, 32 percent of crop farmworkers were U.S. born, 7 percent were immigrants who had obtained U.S. citizenship, 19 percent were other authorized immigrants (primarily permanent residents or green-card holders), and the remaining 42 percent held no work authorization.

