
Agriculture made up 6 percent of total U.S. import value in FY 2023
- by James Kaufman, Bart Kenner and Angelica Williams
- 9/18/2024
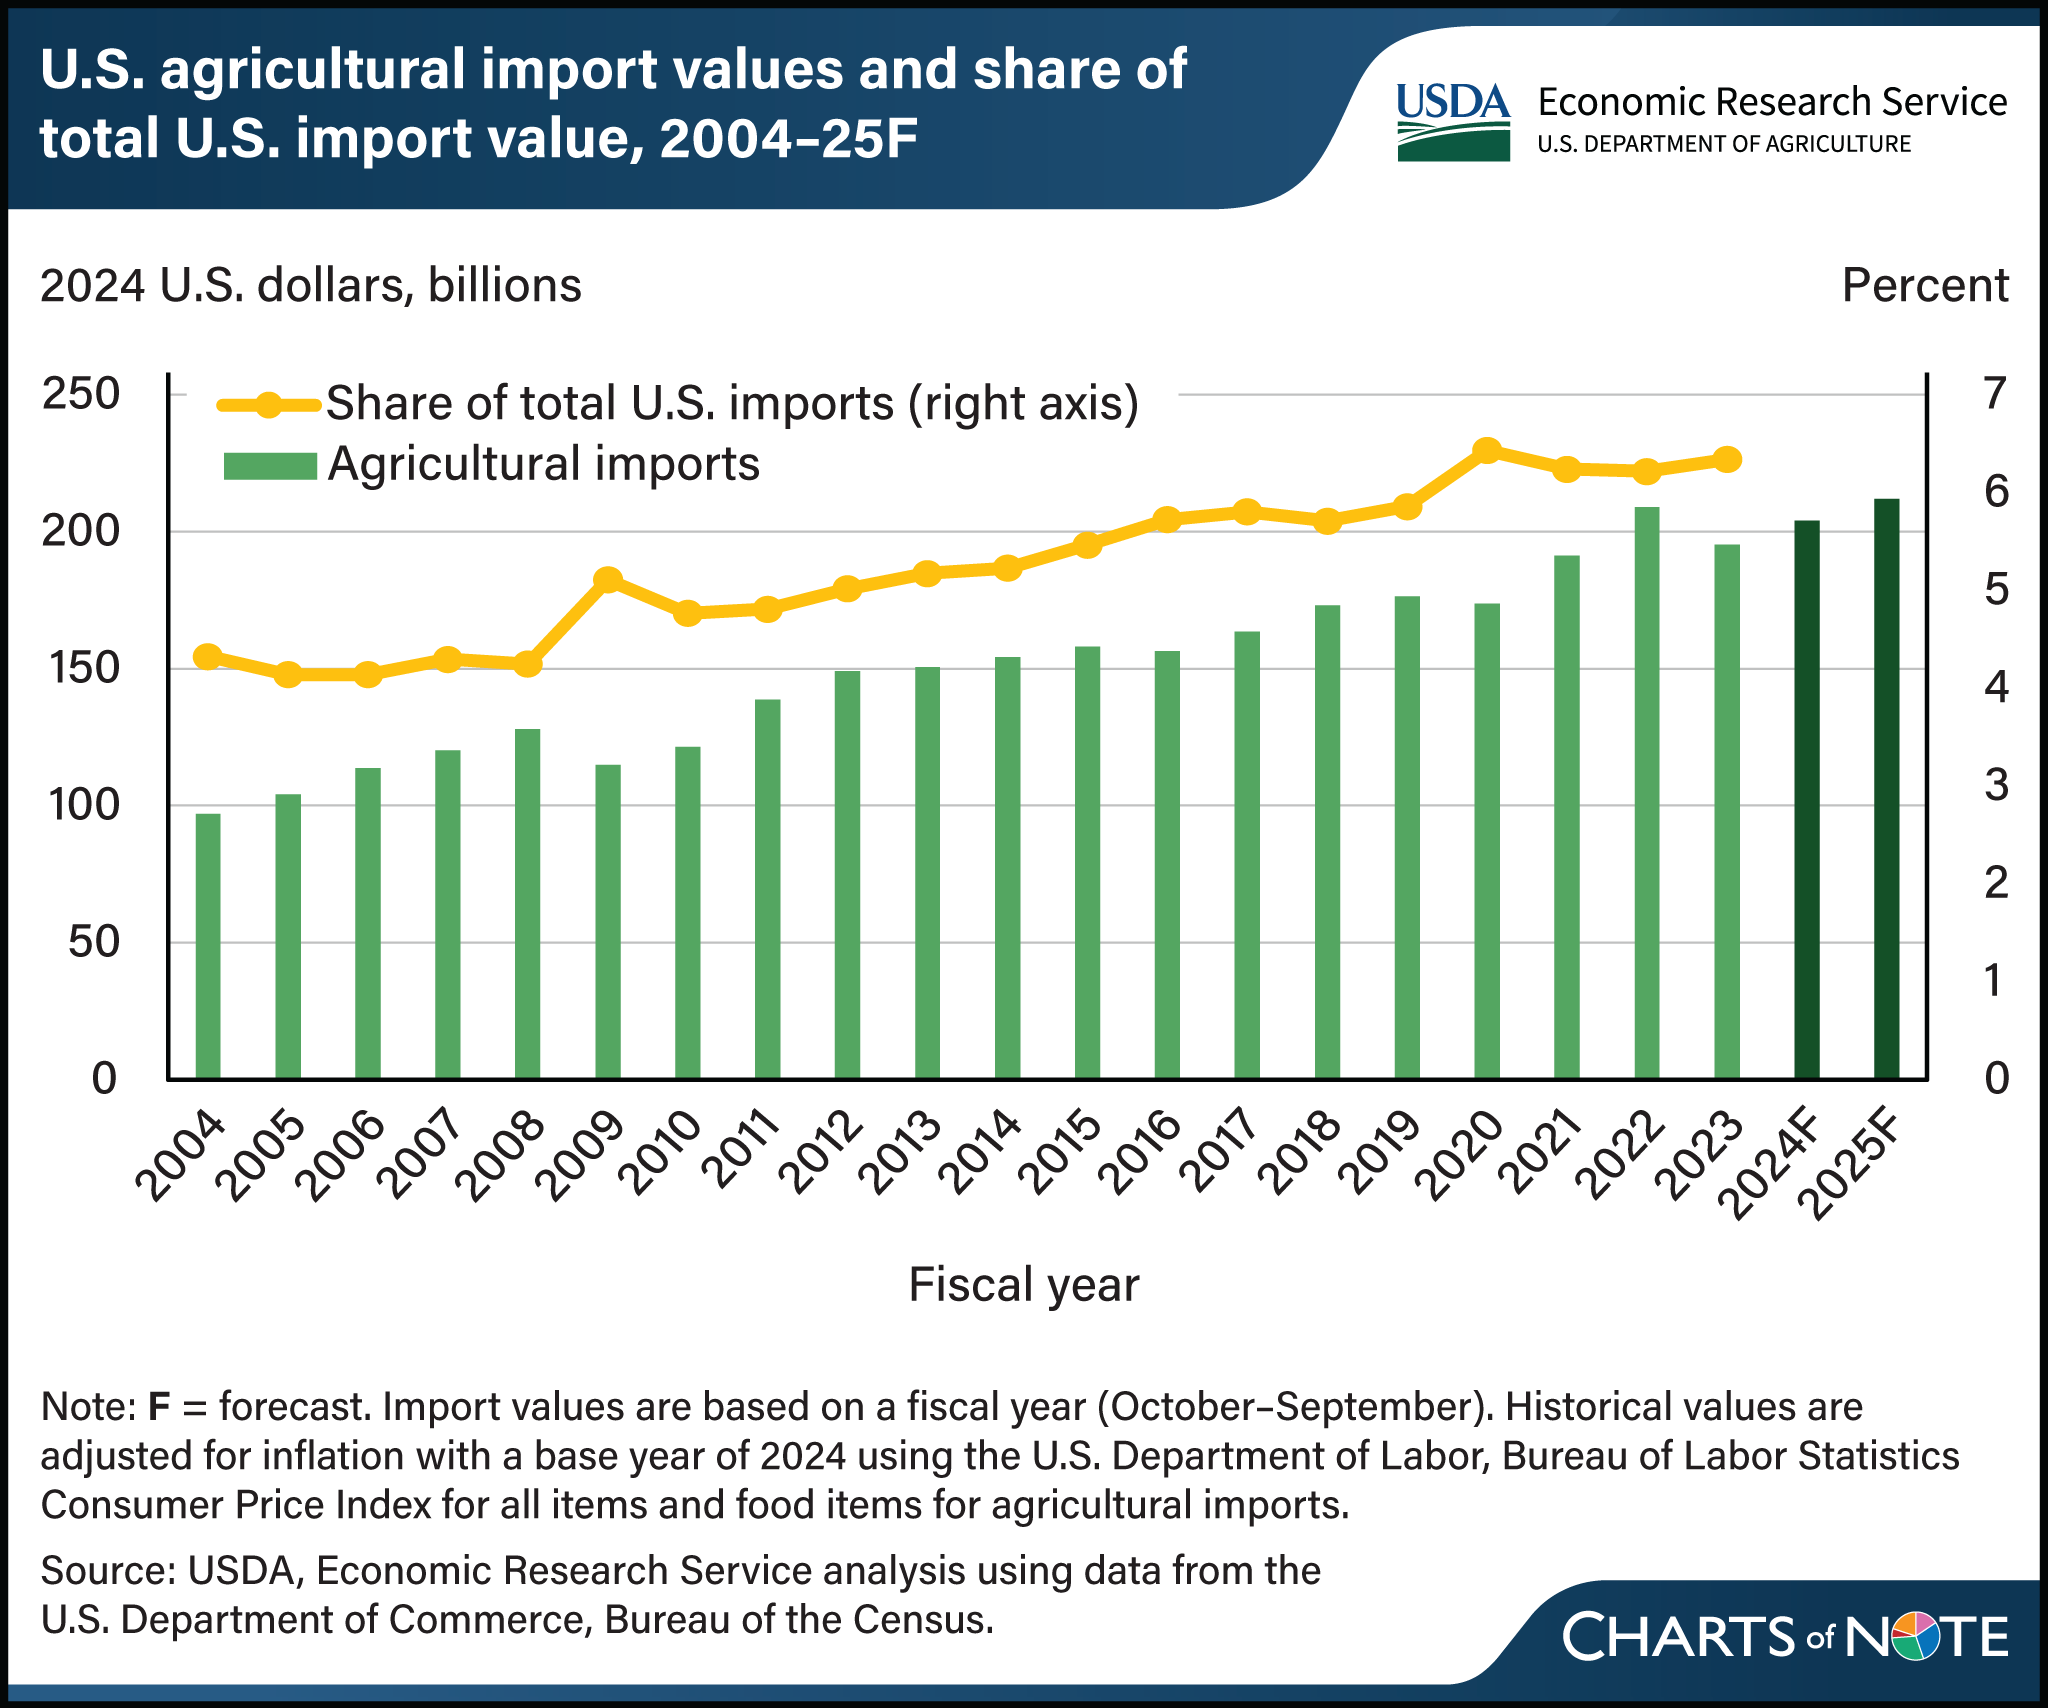
The bulk of U.S. imports fall into categories of consumer goods, capital goods, and industrial supplies. However, agricultural products account for an increasing share of total U.S. imports. From fiscal years (FY) 2004 to 2023, the value of U.S. imports of agricultural products rose an average 3.7 percent annually, adjusting for inflation, exceeding the overall rate of increase for total U.S. imports. Led by increases in processed food and beverages, horticultural products, and livestock products, agricultural imports are forecast to reach $204 billion in FY 2024 and a record $212 billion in FY 2025. Moreover, in 2023, agricultural imports accounted for 6.3 percent of the total value, up from 4.3 percent in 2004. U.S. consumers’ growing appetites for high-valued imported goods such as fresh fruits and vegetables, alcoholic beverages, and processed grain products have helped drive the rapid expansion of agricultural imports. Imported goods often include products that can’t easily be sourced in the United States, such as tropical products, off-season produce, or protected designated-origin products like Parmigiano Reggiano and Champagne. This chart is drawn from the Outlook for U.S. Agricultural Trade: August 2024 published by USDA’s Economic Research Service.
We’d welcome your feedback!
Would you be willing to answer a few quick questions about your experience?