
2022 Census of Agriculture: Average farmland value higher on coasts and in Corn Belt
- by Scott Callahan
- 6/24/2024
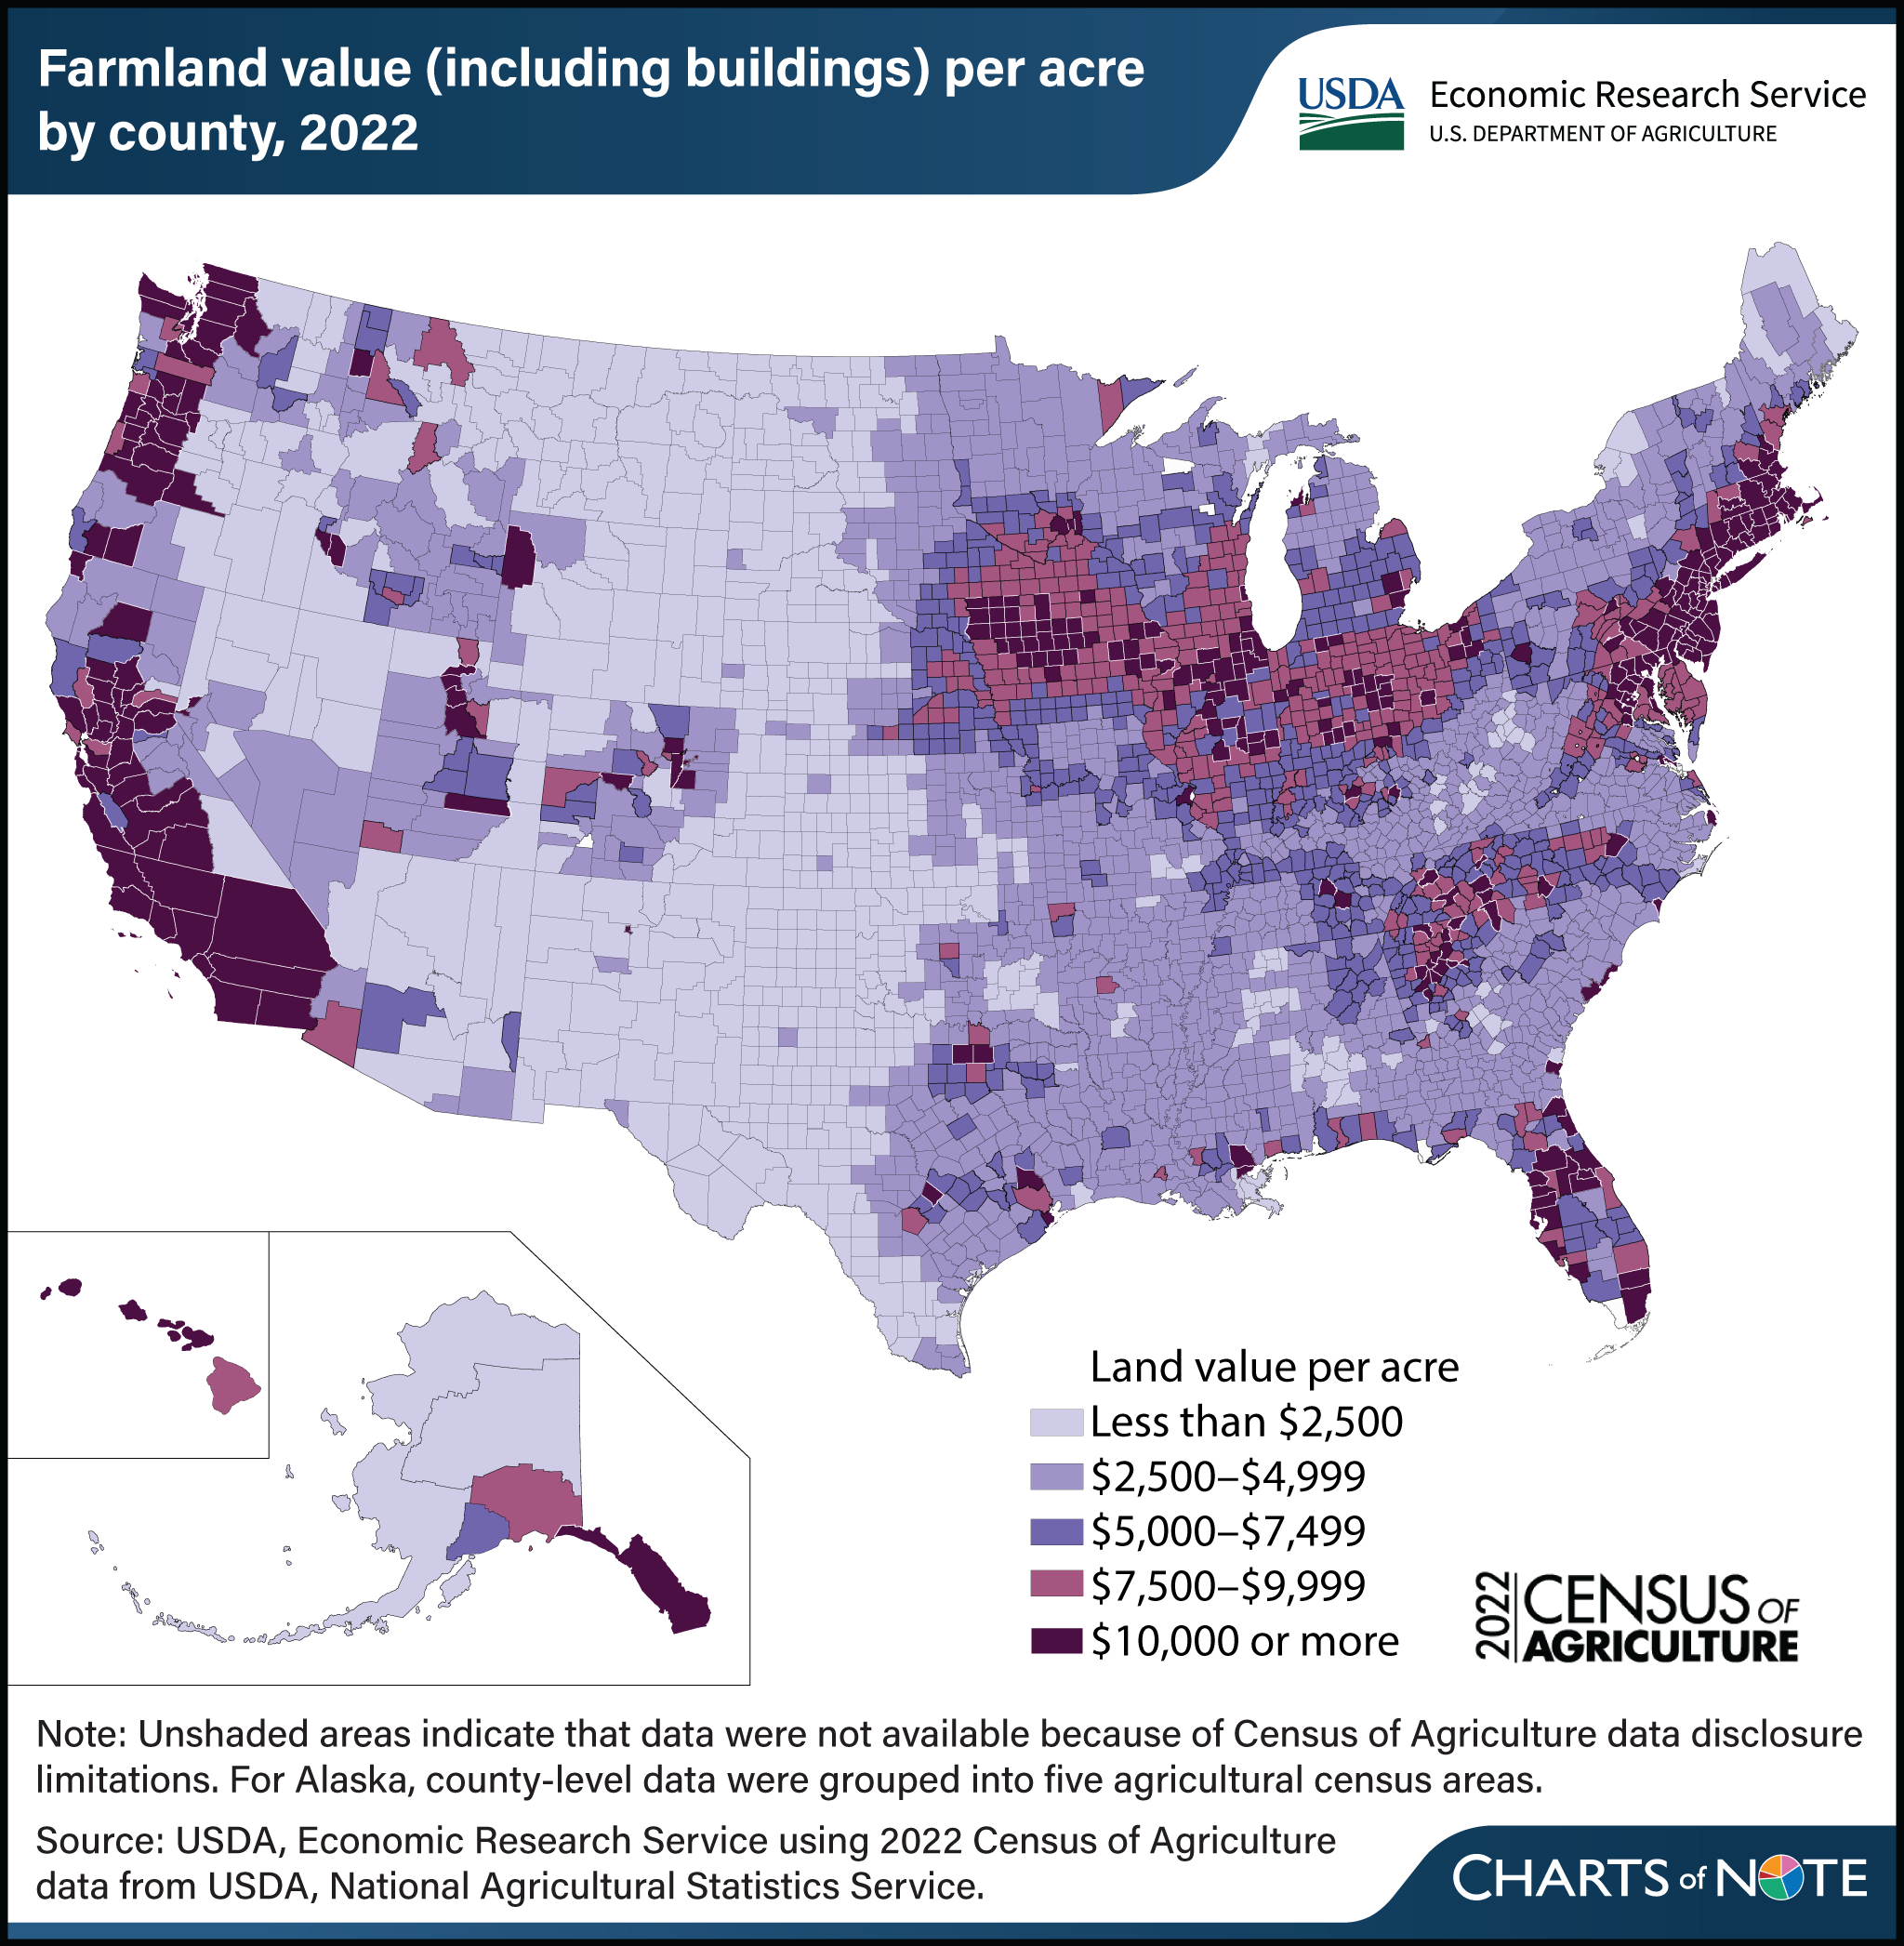
Data from the USDA Census of Agriculture report that farmland values tend to be higher along the coasts and a stretch from Iowa to Ohio, often called the Corn Belt. Lower average county farmland values in the Mountain States (States that encompass the Rocky Mountains) and Great Plains (the area just east of the Rocky Mountains) are likely because of their high share of pastureland, typically valued below that of cropland. Conducted every 5 years by USDA’s National Agricultural Statistics Service (NASS), the Census of Agriculture includes producer responses to questions about their farming operations on a range of topics, including the value of farmland they operate. The national average value per acre of farmland (including buildings) was $3,846 in 2022. Farmland values increased 10 percent after adjusting for inflation (using the Gross Domestic Product Price Index) when compared with the 2017 Census of Agriculture. Farmland tends to be more valuable in States where cropland is more productive and the value of production is higher, such as in the Corn Belt. The map also shows that farmland values increase in counties in the immediate vicinity of urban areas or with higher population density overall, reflecting competition with residential and other nonagricultural land uses. For more details on farmland values, see USDA, Economic Research Service’s Farmland Value topic page. For more details from the 2022 Census of Agriculture, see the NASS Census of Agriculture page.