
Exports expand market for U.S. food and agricultural goods
- by James Kaufman and Bart Kenner
- 5/20/2024
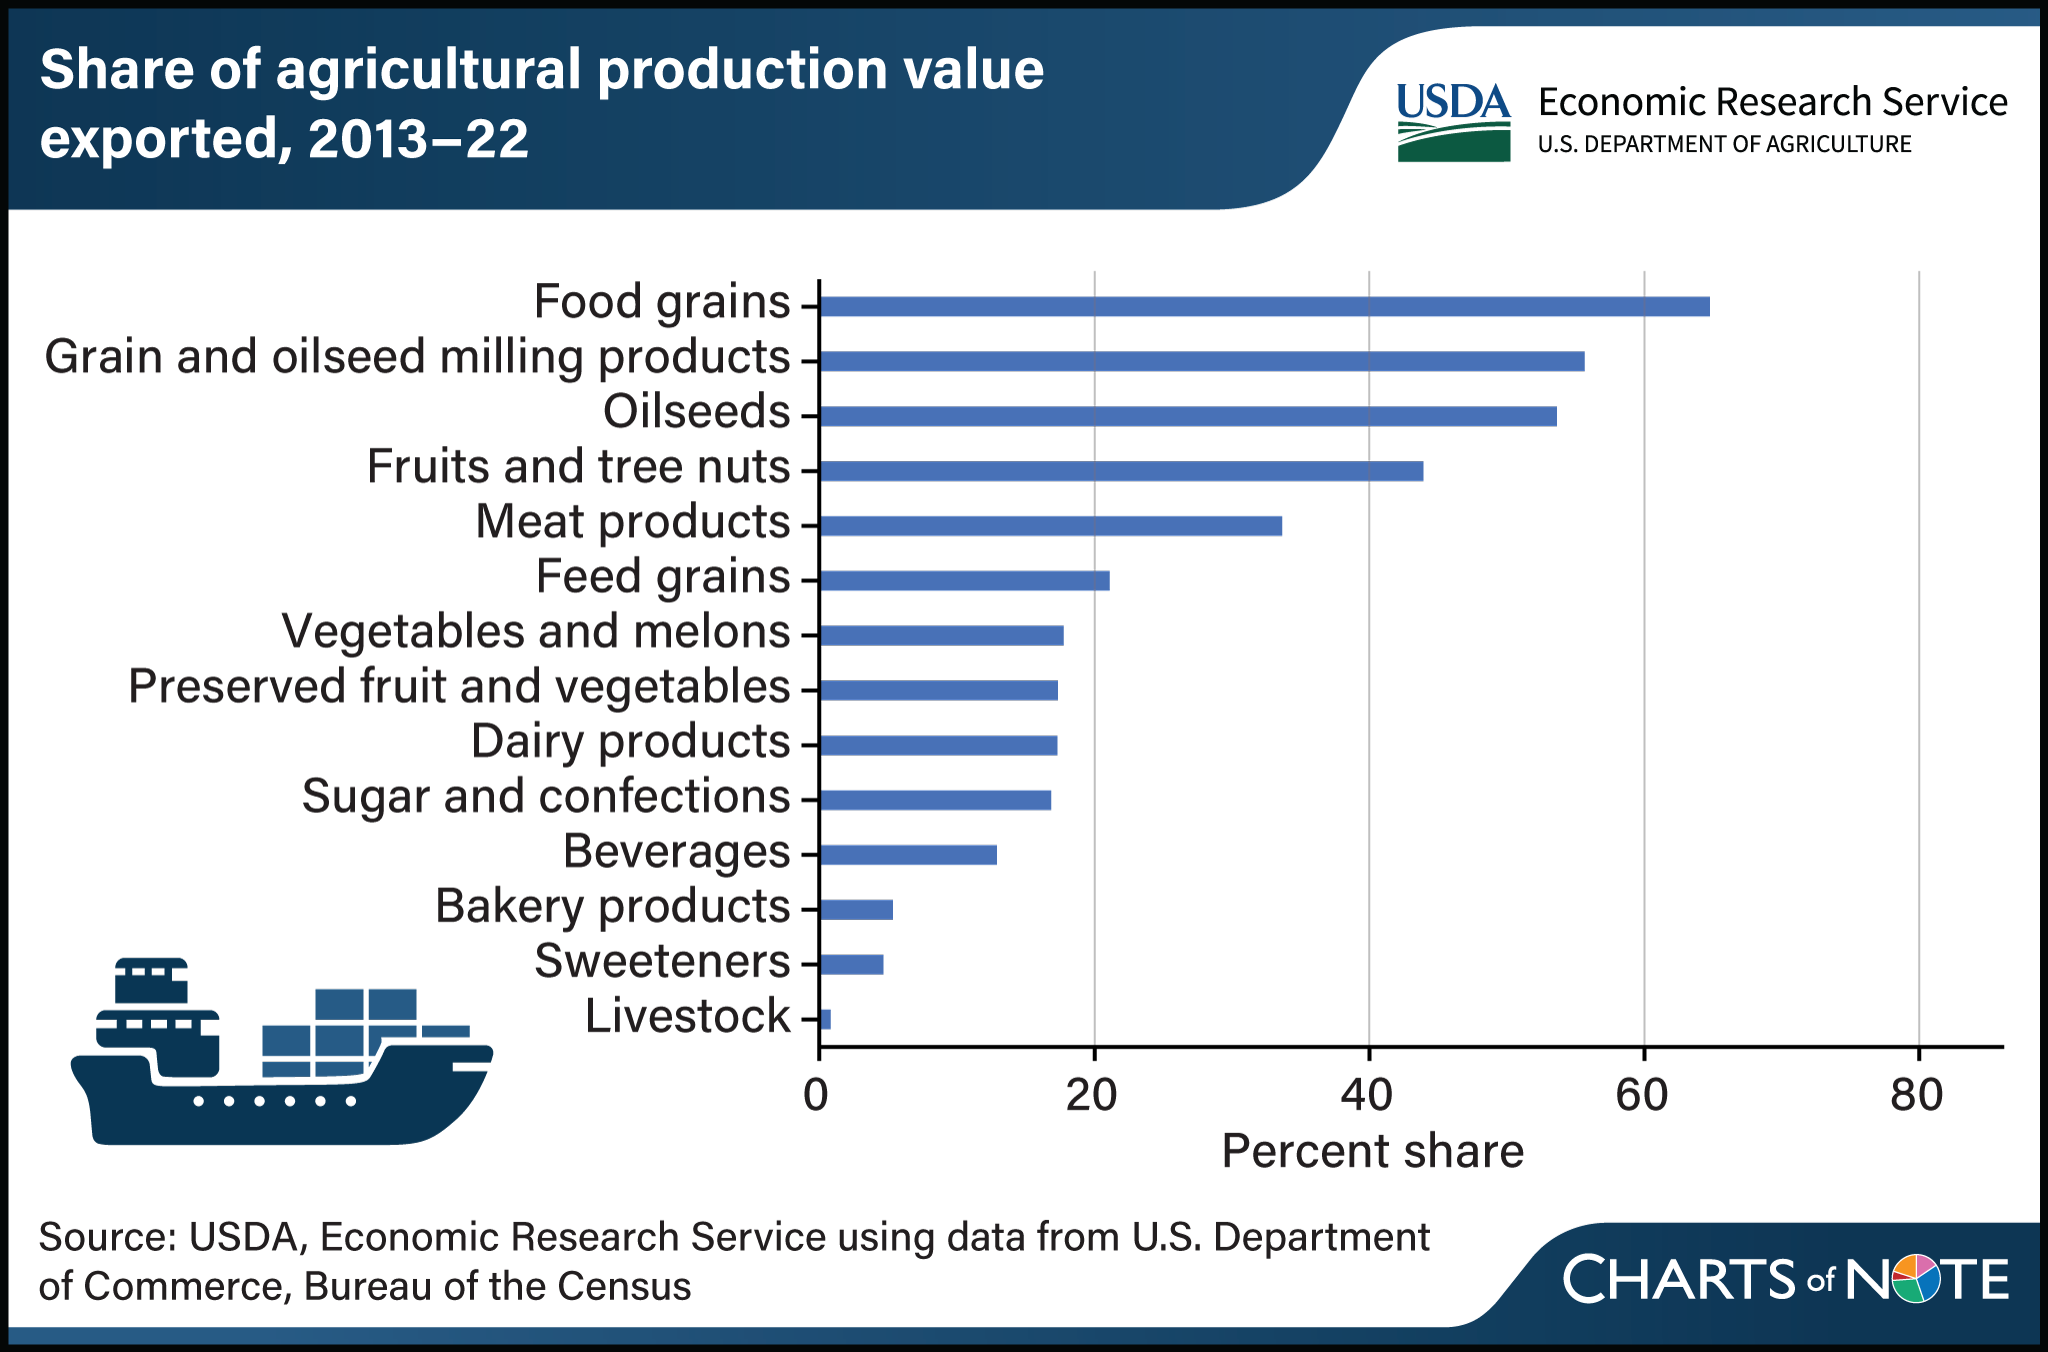
Export markets are an important sales outlet for U.S. food and agricultural production. Since 2008, an average of 20 percent of the value of all U.S. agricultural output has been shipped to destinations in other countries. The export market is a growing one for U.S. non-manufactured products, a group including commodities such as grains, oilseeds, and produce. In the past 10 years, the export of these commodities has increased as a percent of production at a rate of 1.4 percent annually. For commodities such as food grains, exports make up about 65 percent of the production value. Fruits and tree nuts exports make up 44 percent of the production value. In contrast, the United States exports a lower share of the value of manufactured goods—a group including sweeteners, bakery products, and dairy products. This overall share has been declining since 2012, indicating that a greater percentage of the value of U.S. production is retained domestically for consumption. Nearly 40 percent of all U.S. agricultural export value comes from bulk commodities, whose unit prices are typically low and fluctuate widely from year to year. In contrast, manufactured goods typically are higher in value per unit compared with bulk or intermediate goods, and prices are relatively steady from one year to the next. This chart was drawn from the USDA, Economic Research Service (ERS) dataset U.S. Export Share of Production, Import Share of Consumption (2008-2022). It also appears in the ERS publication Selected Charts from Ag and Food Statistics: Charting the Essentials, 2024.
We’d welcome your feedback!
Would you be willing to answer a few quick questions about your experience?