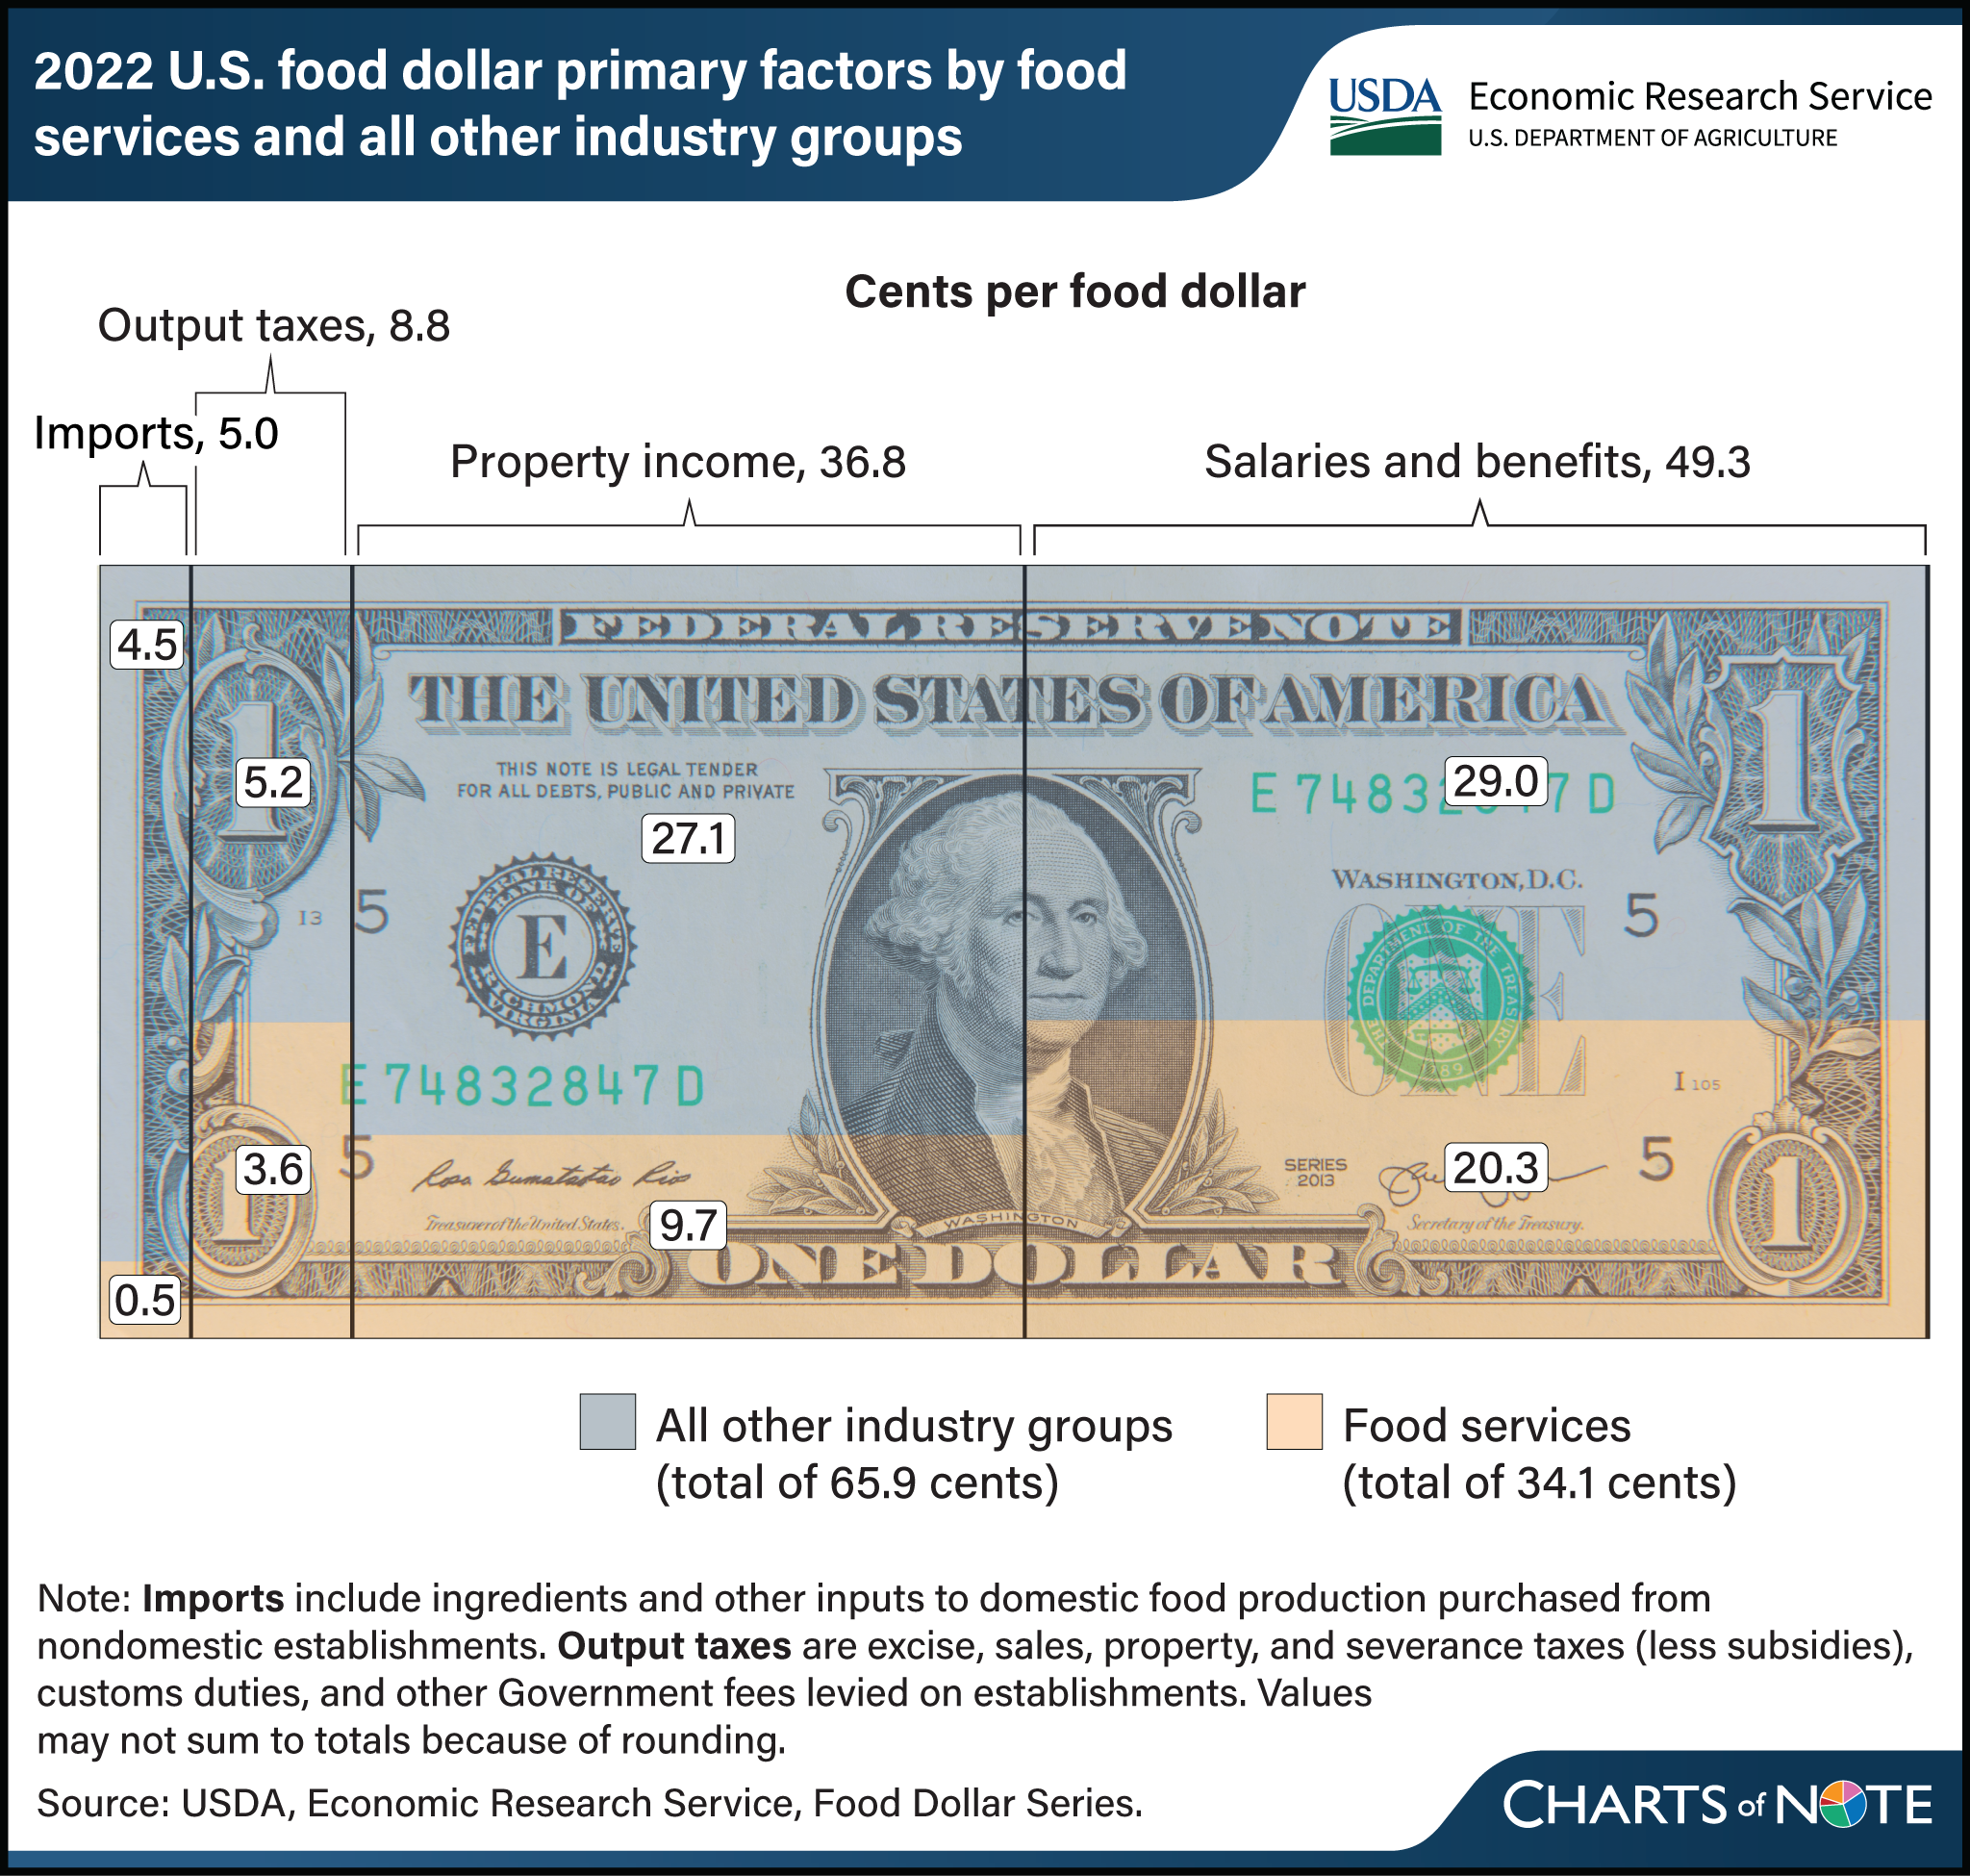
About 20 cents of each dollar spent on food in 2022 went to foodservice labor costs
- by Quinton Baker and James Chandler Zachary
- 4/29/2024

Primary factors are the resources used by firms to convert raw materials and intermediate goods into finished products and services. In 2022, the primary factor shares across the domestic food supply chain were 5.0 cents of every dollar spent on domestically produced food for imports, 8.8 cents for output taxes, 36.8 cents for property income, and 49.3 cents for salaries and benefits. These primary factors can also be separated by industry groups, which are collections of establishments that produce similar types of products or services, including transportation, food processing, and retail trade. The foodservices industry group, which includes eating and drinking establishments such as restaurants, received a total of 34.1 cents of each dollar spent on domestically produced food. Of this amount, salary and benefits were 20.3 cents and property income was 9.7 cents. These costs in the foodservices industry group rank as the two highest primary factor costs of all the 12 industry groups measured in the Food Dollar Series. Additionally, 3.6 cents went to output taxes, such as excise, sales, and other taxes on production, less subsidies; and 0.5 cents went to embedded imports—imported ingredients and equipment used in domestic production. This chart uses information in the USDA, Economic Research Service (ERS) Food Dollar Series data product, updated November 15, 2023, and the Amber Waves article ERS Food Dollar's Three Series Show Distributions of U.S. Food Production Costs, published in December 2023.

