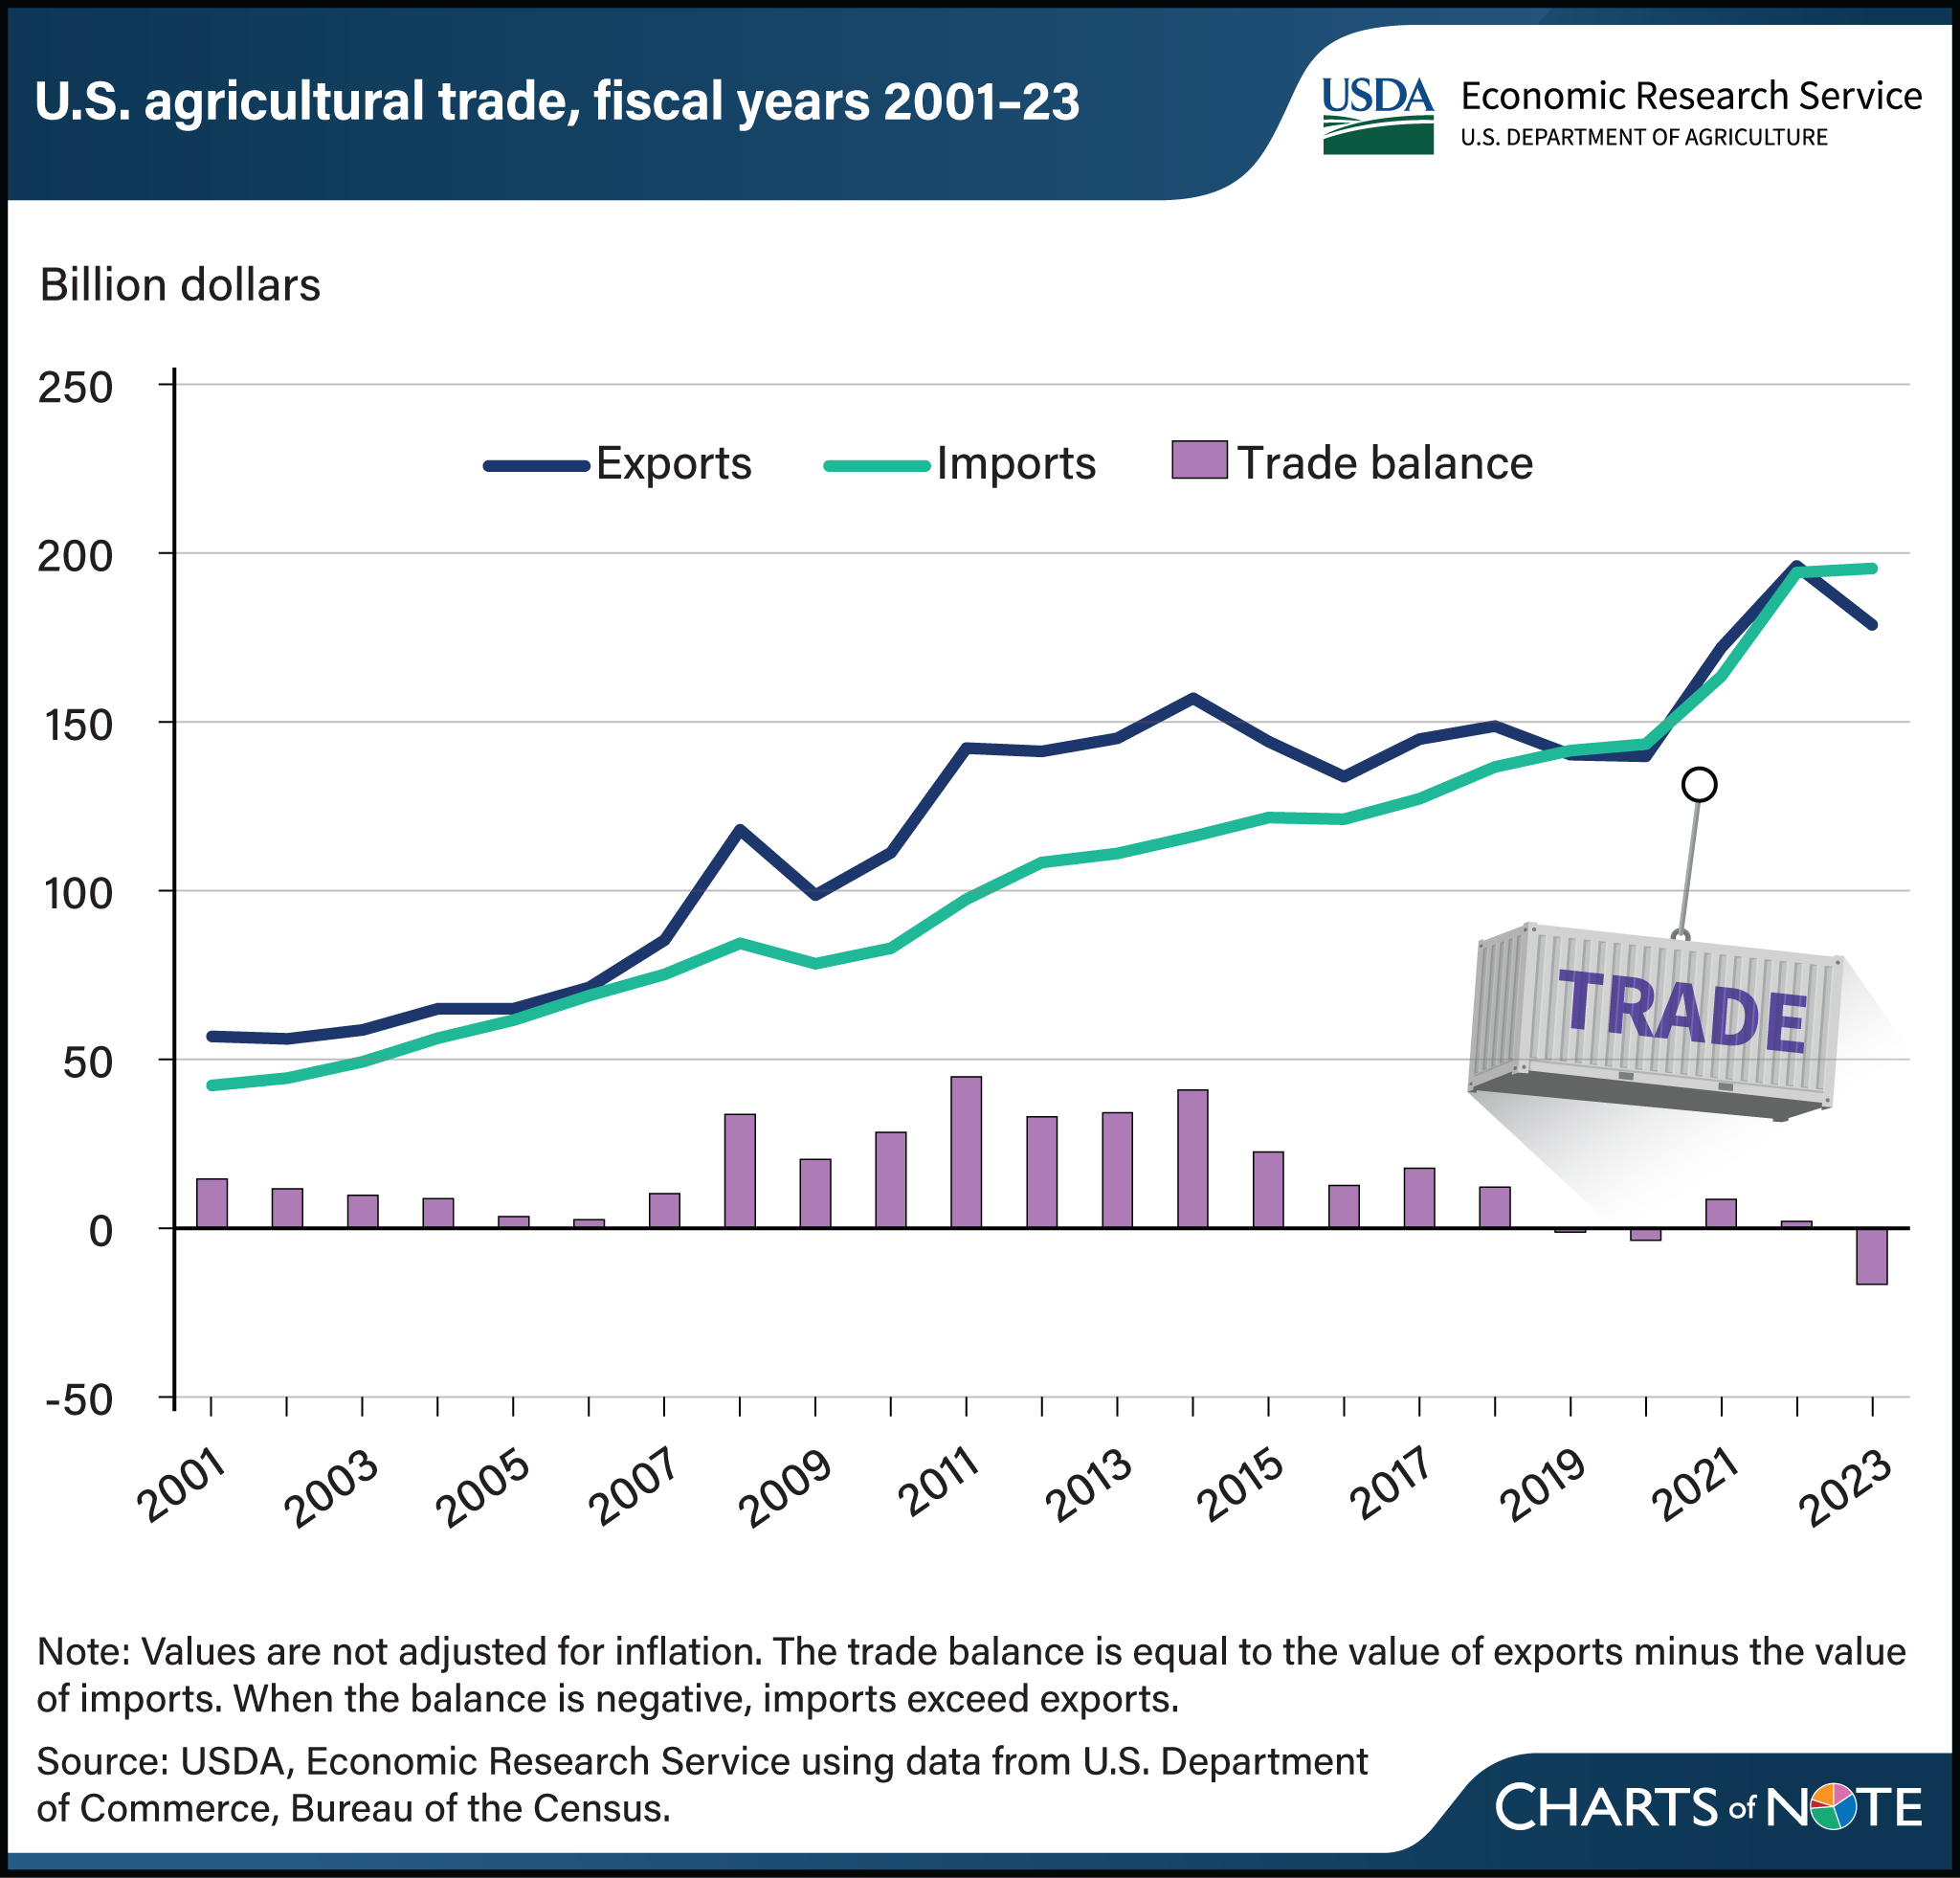
U.S. agricultural import values outpaced export values in fiscal year 2023
- by James Kaufman and Bart Kenner
- 3/19/2024

The U.S. agricultural trade balance measures the difference between the values of exported farm goods and those imports from other countries. For nearly 60 years, U.S. agricultural trade maintained a surplus, but in fiscal year (FY) 2019, the balance shifted to a deficit, where it has stayed 3 out of the last 5 fiscal years. In FY 2023, U.S. agricultural imports exceeded exports by $16.6 billion. Imports have largely followed a stable upward trend, while exports have had relatively wide swings. From FY 2013 to 2023, import values increased at a compound annual growth rate of 5.8 percent, and exports grew at a rate of 2.1 percent. Although the U.S. agricultural trade balance is closely watched, it reflects changing consumer tastes, a robust economy, and a strong dollar, and is not an indicator of export competitiveness or import dependence. The U.S. consumer’s growing appetite for high-valued imported goods—such as fruits and vegetables, alcoholic beverages, and processed grain products—has contributed to the expanding trade deficit. Those goods often include products that can’t be easily sourced in the United States, such as tropical products or off-season produce. In contrast, nearly 40 percent of U.S. exports are bulk commodities, whose prices respond more rapidly to global markets. This chart also appears in the USDA, Economic Research Service report Selected Charts from Ag and Food Statistics: Charting the Essentials, 2024.

