

… but spending at full-service restaurants remained much lower than it had been before the pandemic
- by Keenan Marchesi and Patrick McLaughlin
- 1/29/2024
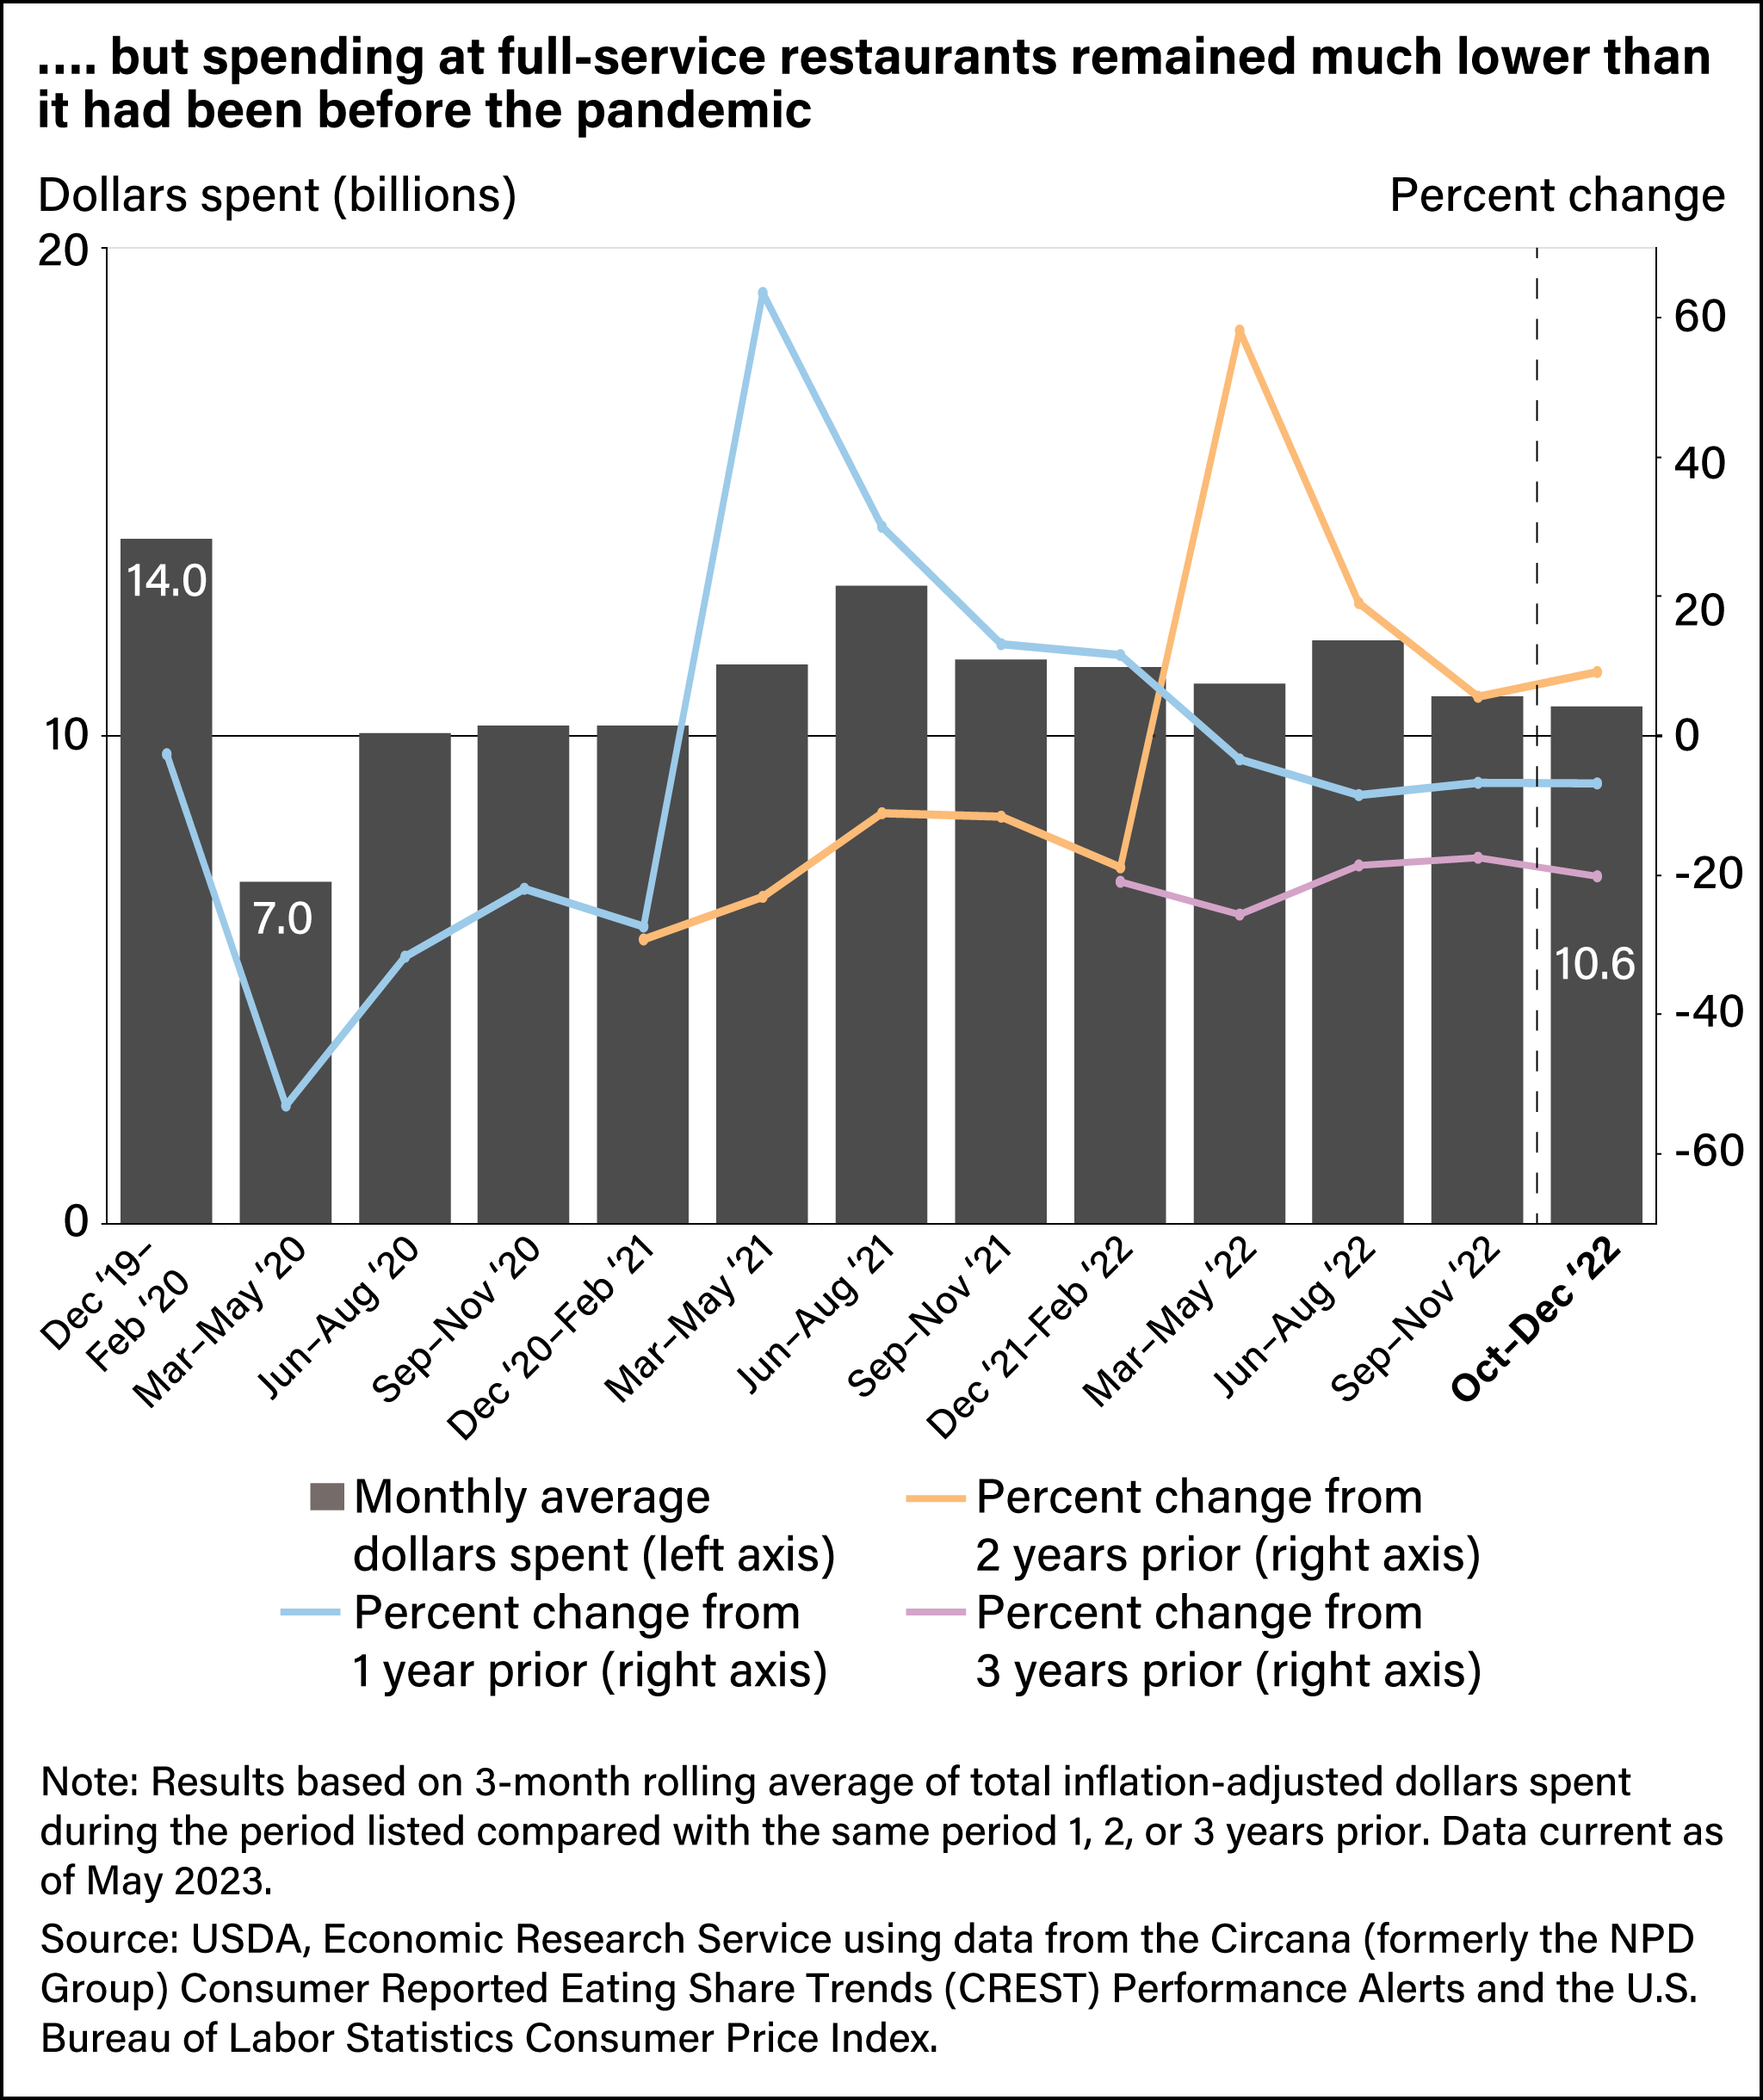
While total annual U.S. food spending levels had recovered from pandemic-related shocks as of 2021, some pandemic-induced changes in what people were buying for food at home and where and how they were purchasing food away from home continued throughout 2022.