

Spending increased across nearly all food-at-home (FAH) categories in first year of pandemic, but returned to closer to prepandemic levels by end of 2022
- by Keenan Marchesi and Patrick W. McLaughlin
- 1/29/2024
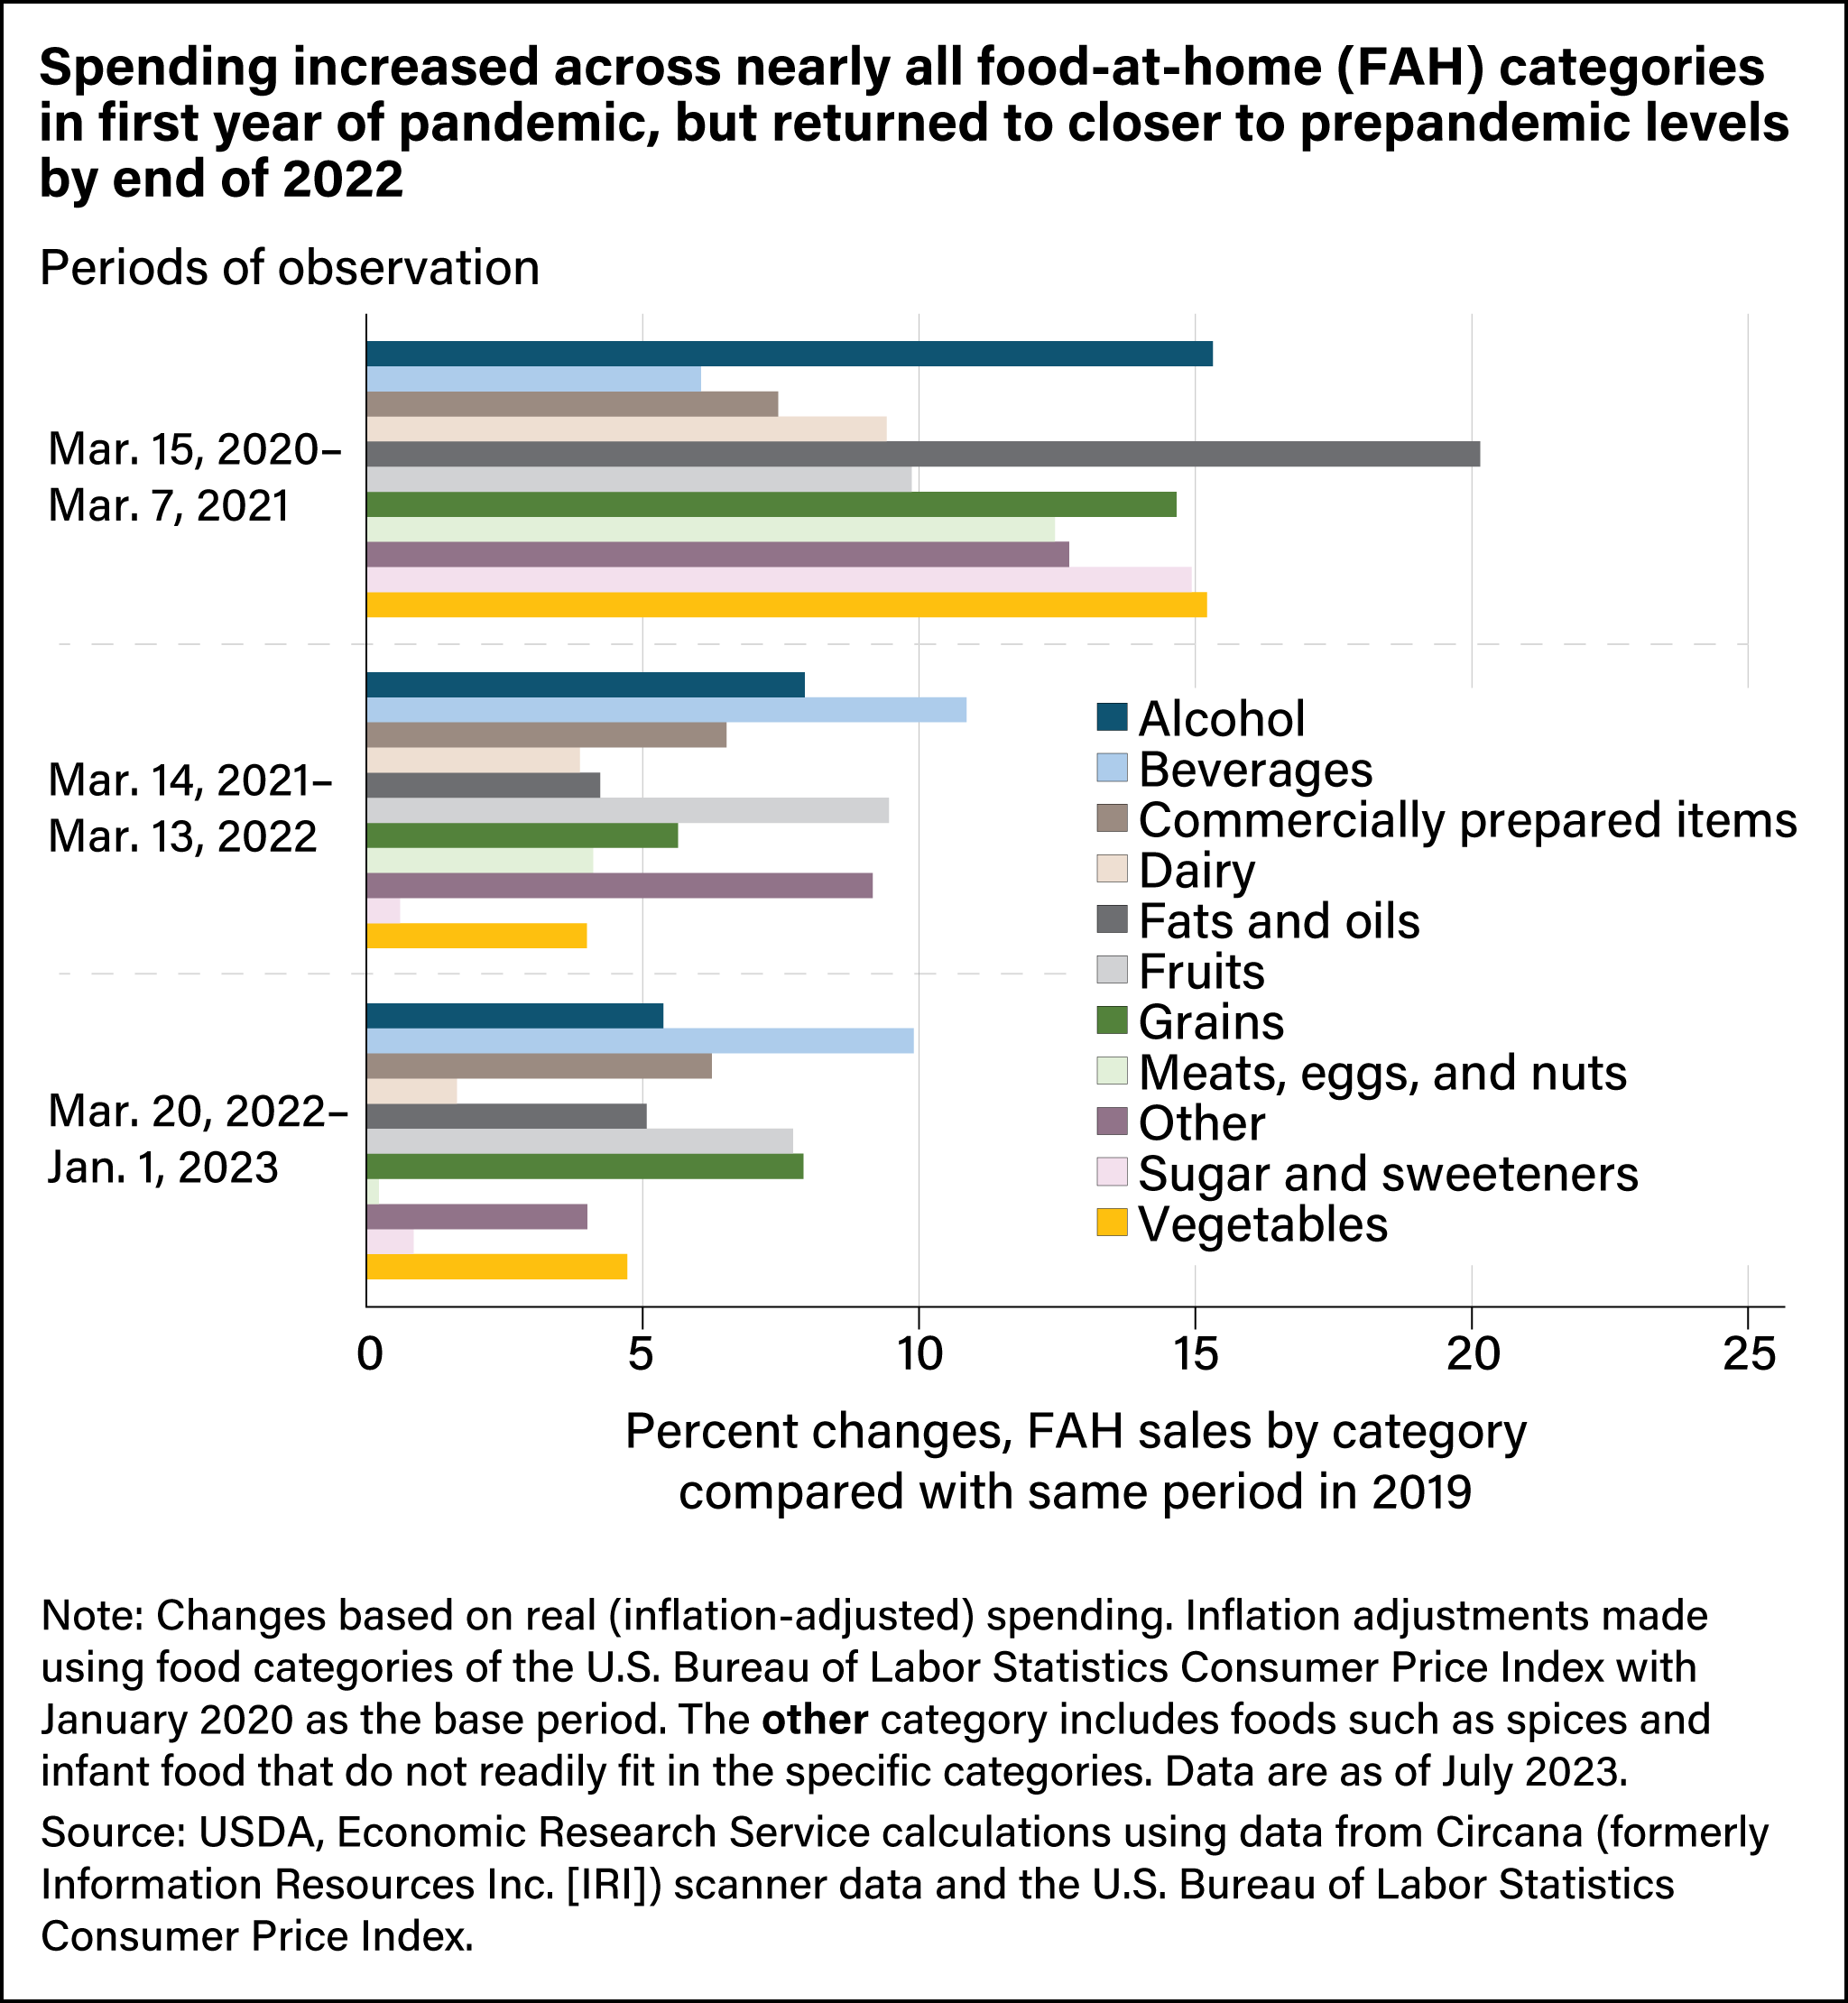
While total annual U.S. food spending levels had recovered from pandemic-related shocks as of 2021, some pandemic-induced changes in what people were buying for food at home and where and how they were purchasing food away from home continued throughout 2022.