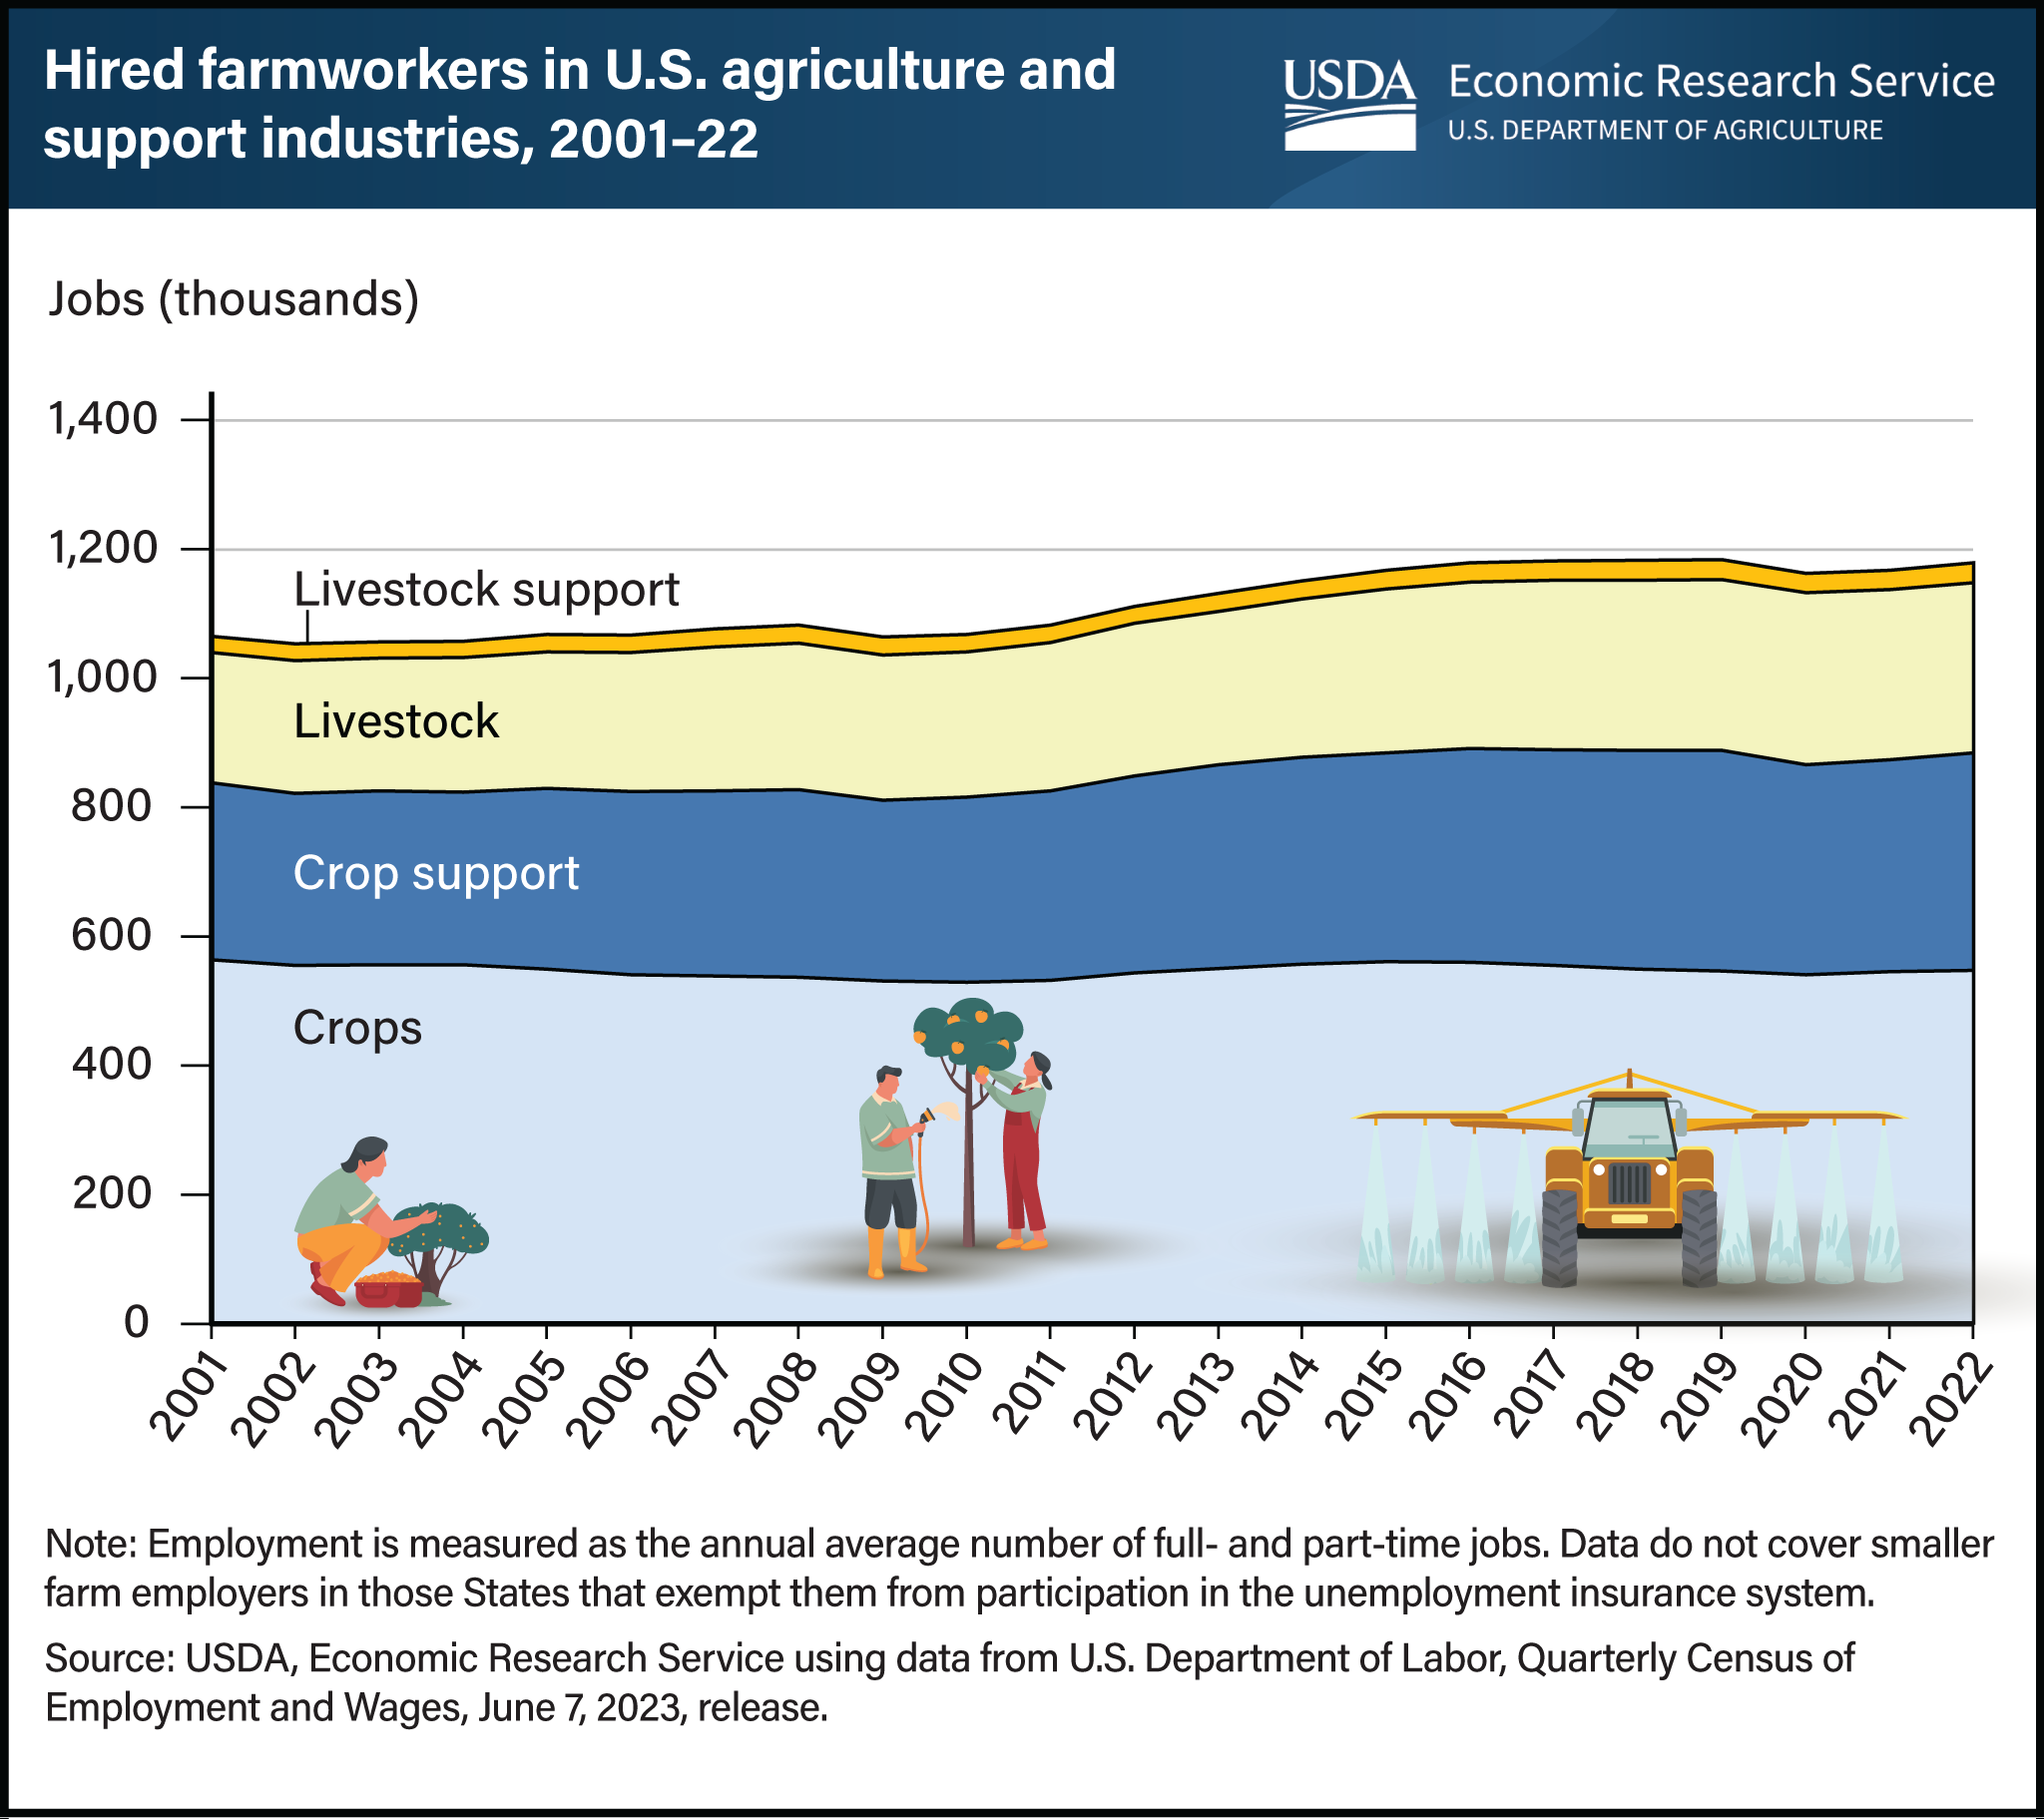
Employment in U.S. agriculture grew 6 percent between 2012 and 2022
- by Marcelo Castillo
- 10/3/2023

Data from the U.S. Bureau of Labor Statistics’ Quarterly Census of Employment and Wages (QCEW) show wage and salaried employment in agriculture stabilized in the 2000s and has been on a gradual upward trend since 2010. U.S. agriculture employment rose from 1.11 million jobs in 2012 to 1.18 million jobs in 2022, a gain of 6 percent. Employment growth was fastest in crop support services (27,500 jobs added, a 12-percent increase) and the livestock sector (31,400 jobs added, a 10-percent increase). Crop support services firms provide specialized services to farmers, including labor contracting and custom harvesting. By comparison, employment of direct hires in the crop sector, which has the largest number of hired farm workers, grew 1 percent. Data from QCEW are based on unemployment insurance records, not on surveys of farms or households. As a result, they do not cover smaller farm employers in States that exempt such employers from participation in the unemployment insurance system. However, survey data sources such as the U.S. Department of Commerce, Census Bureau’s American Community Survey and Current Population Survey also show rising farm employment since the turn of the 21st century. This chart appears in the USDA, Economic Research Service topic page Farm Labor, updated in August 2023.


