

Trends in weekly food-at-home sales by value and quantity began to diverge in early 2022
- by Megan Sweitzer
- 7/10/2023
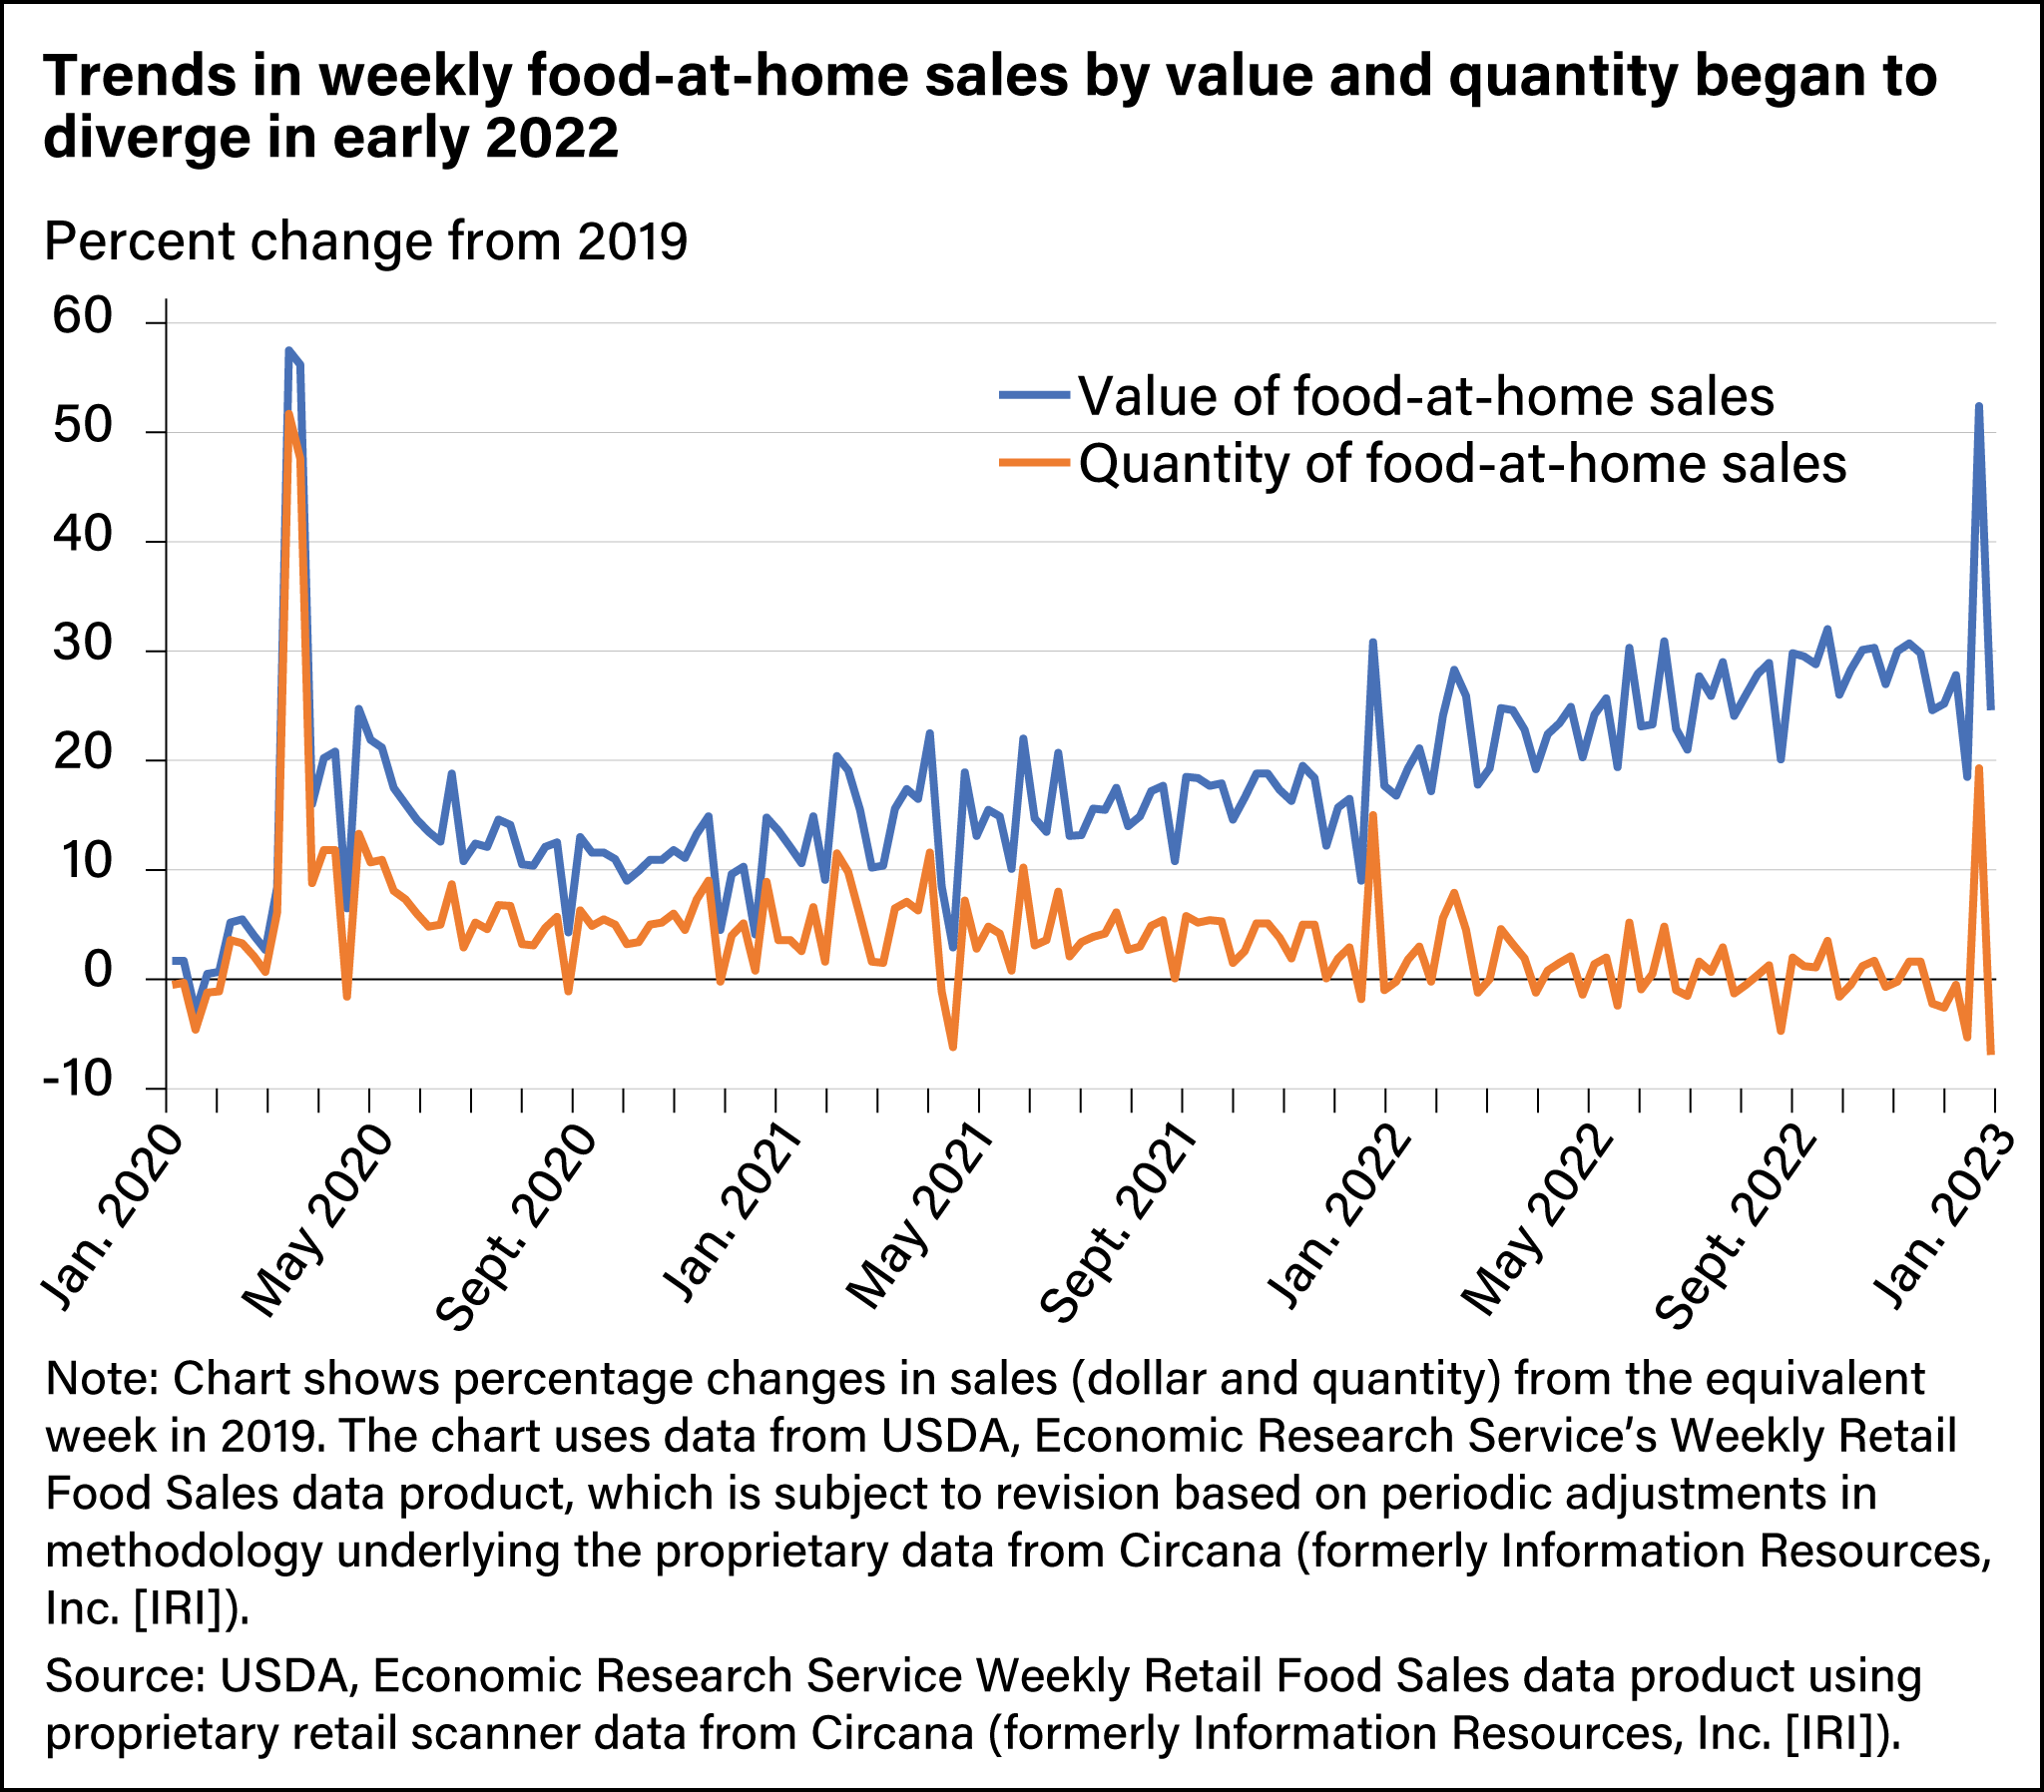
Line chart comparing changes in food-at-home sales, in dollars and quantity, between January 2020 and January 2023 with equivalent weeks in 2019.