

U.S. farm inputs have shifted from labor and land to capital, materials, and purchased services in past 70 years
- by Sun Ling Wang
- 2/13/2023
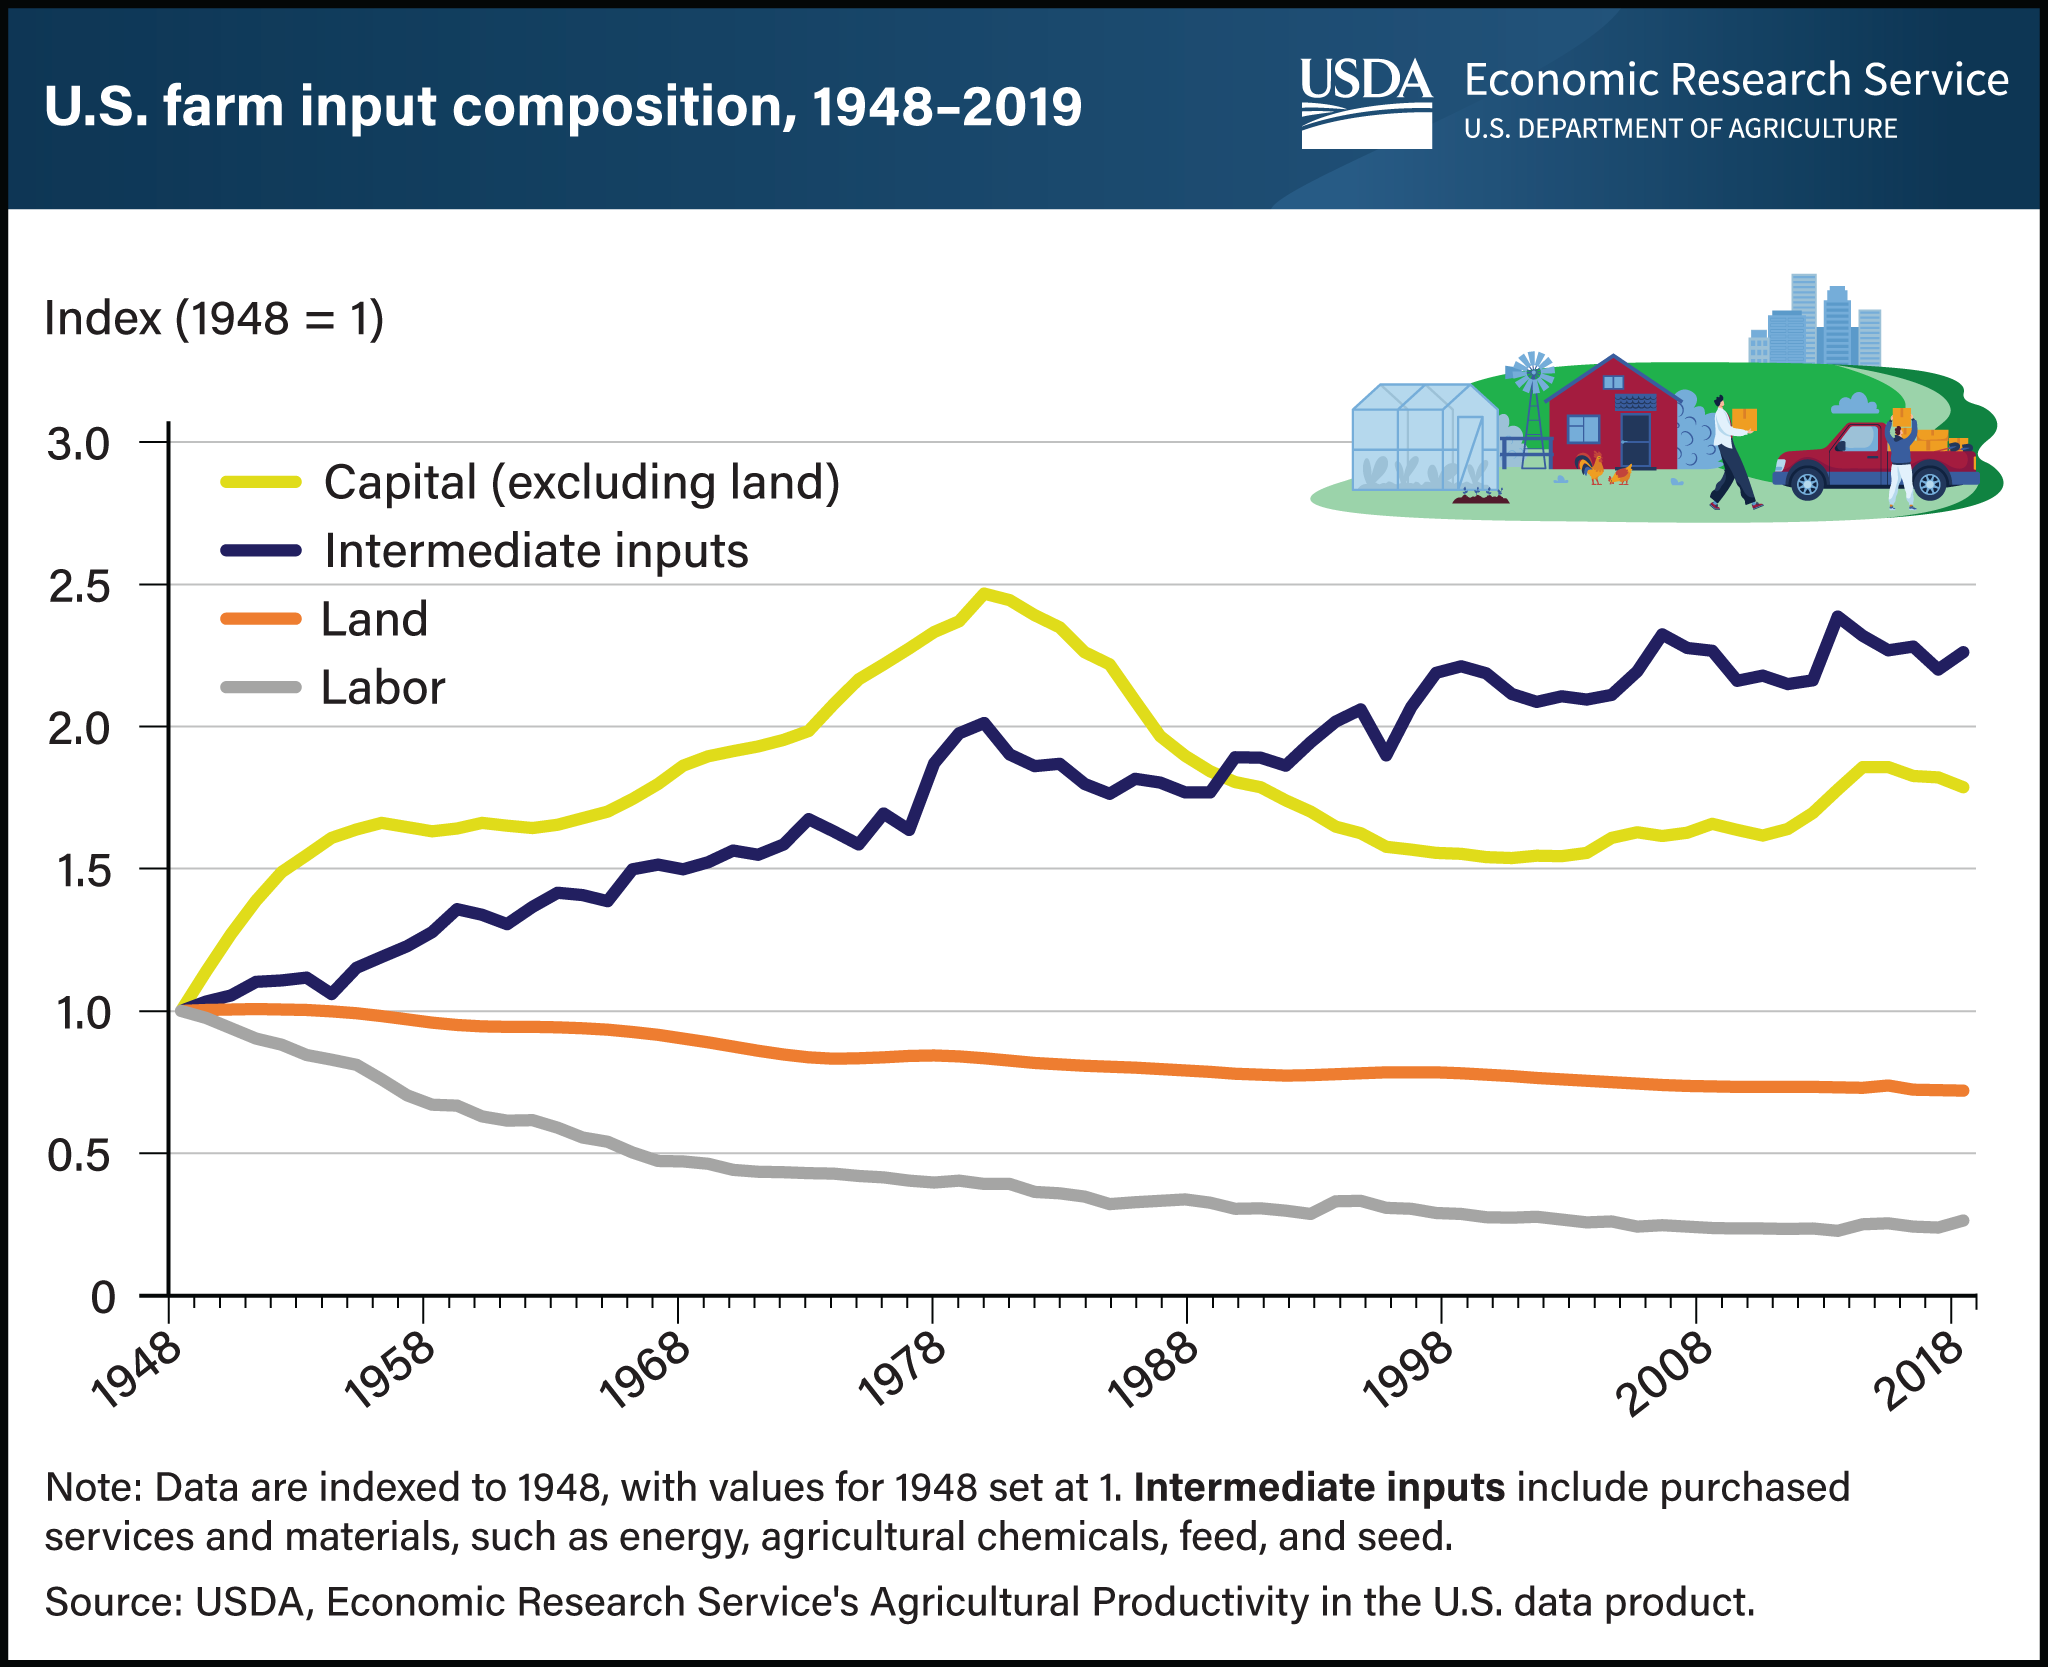
U.S. farm output—the total amount of livestock, crops, and other farm-related outputs produced in a year—tripled in the seven decades from 1948 to 2019. At the same time, the total amount of inputs used in U.S. farm production only increased slightly by 4 percent, at an annual rate of 0.06 percent, partly because of a shift away from labor and land and toward non-land capital and other intermediate inputs. From 1948 to 2019, the amount of farm labor used in the production of U.S. agricultural commodities fell 74 percent, and land use declined 28 percent. On the other hand, the use of intermediate inputs such as fertilizer, pesticides, and purchased services grew 126 percent, and the use of capital inputs such as machinery and farm structures (chicken houses and greenhouses, for example) grew 79 percent. Over the years, technological changes have made inputs such as machinery and agricultural chemicals more affordable for farmers and have partially replaced labor and land inputs in the production process. As a result, increased productivity has been the primary source of growth in U.S. agricultural output. Over the 70 years, farm output grew at an average annual rate of 1.42 percent, and productivity contributed 1.36 percentage points to that growth rate. This chart appears in the Amber Waves article U.S. Agricultural Output Has Grown Slower in Response to Stagnant Productivity Growth, published in October 2022.