
USDA’s International Baseline Visualization tool offers interactive way to explore global agricultural trends
- by Adam Gerval
- 7/19/2022
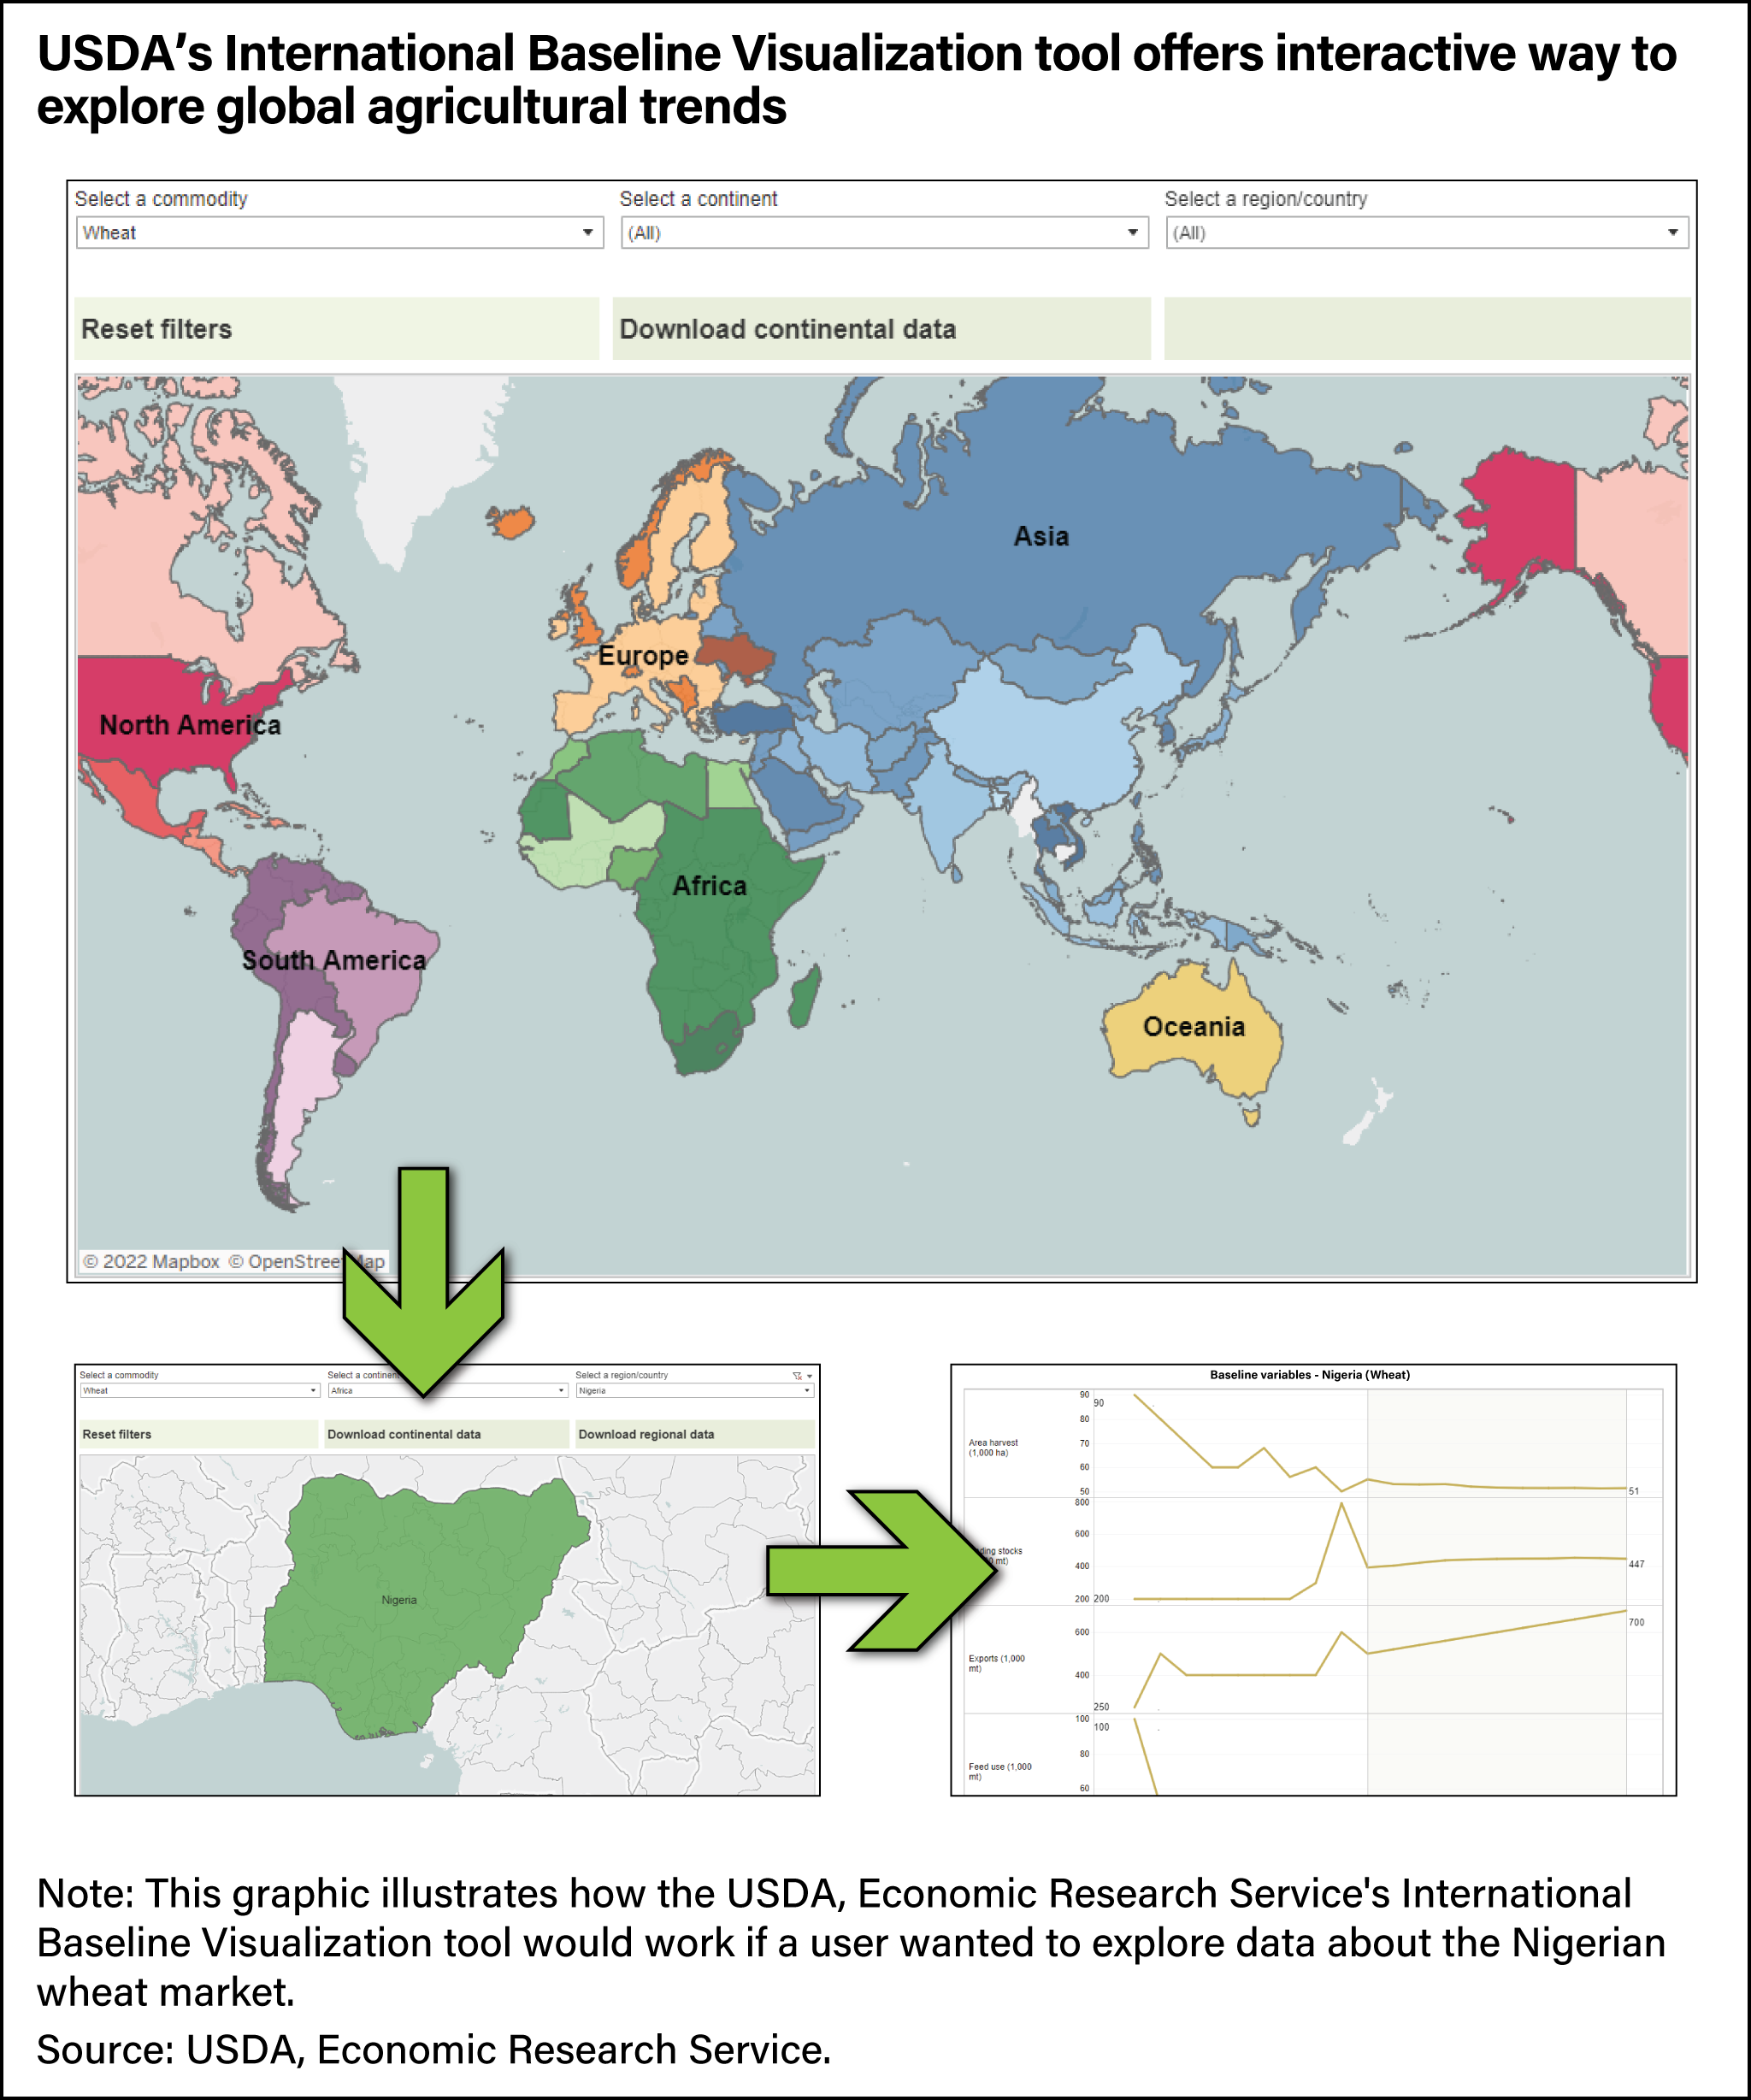
Maps and a line chart depicting an example of how the ERS International Baseline Visualization tool works for users.