

Sales at retail food stores were higher in May 2022 than May 2019, but growth varied by food category
- by Alexander Stevens
- 6/30/2022
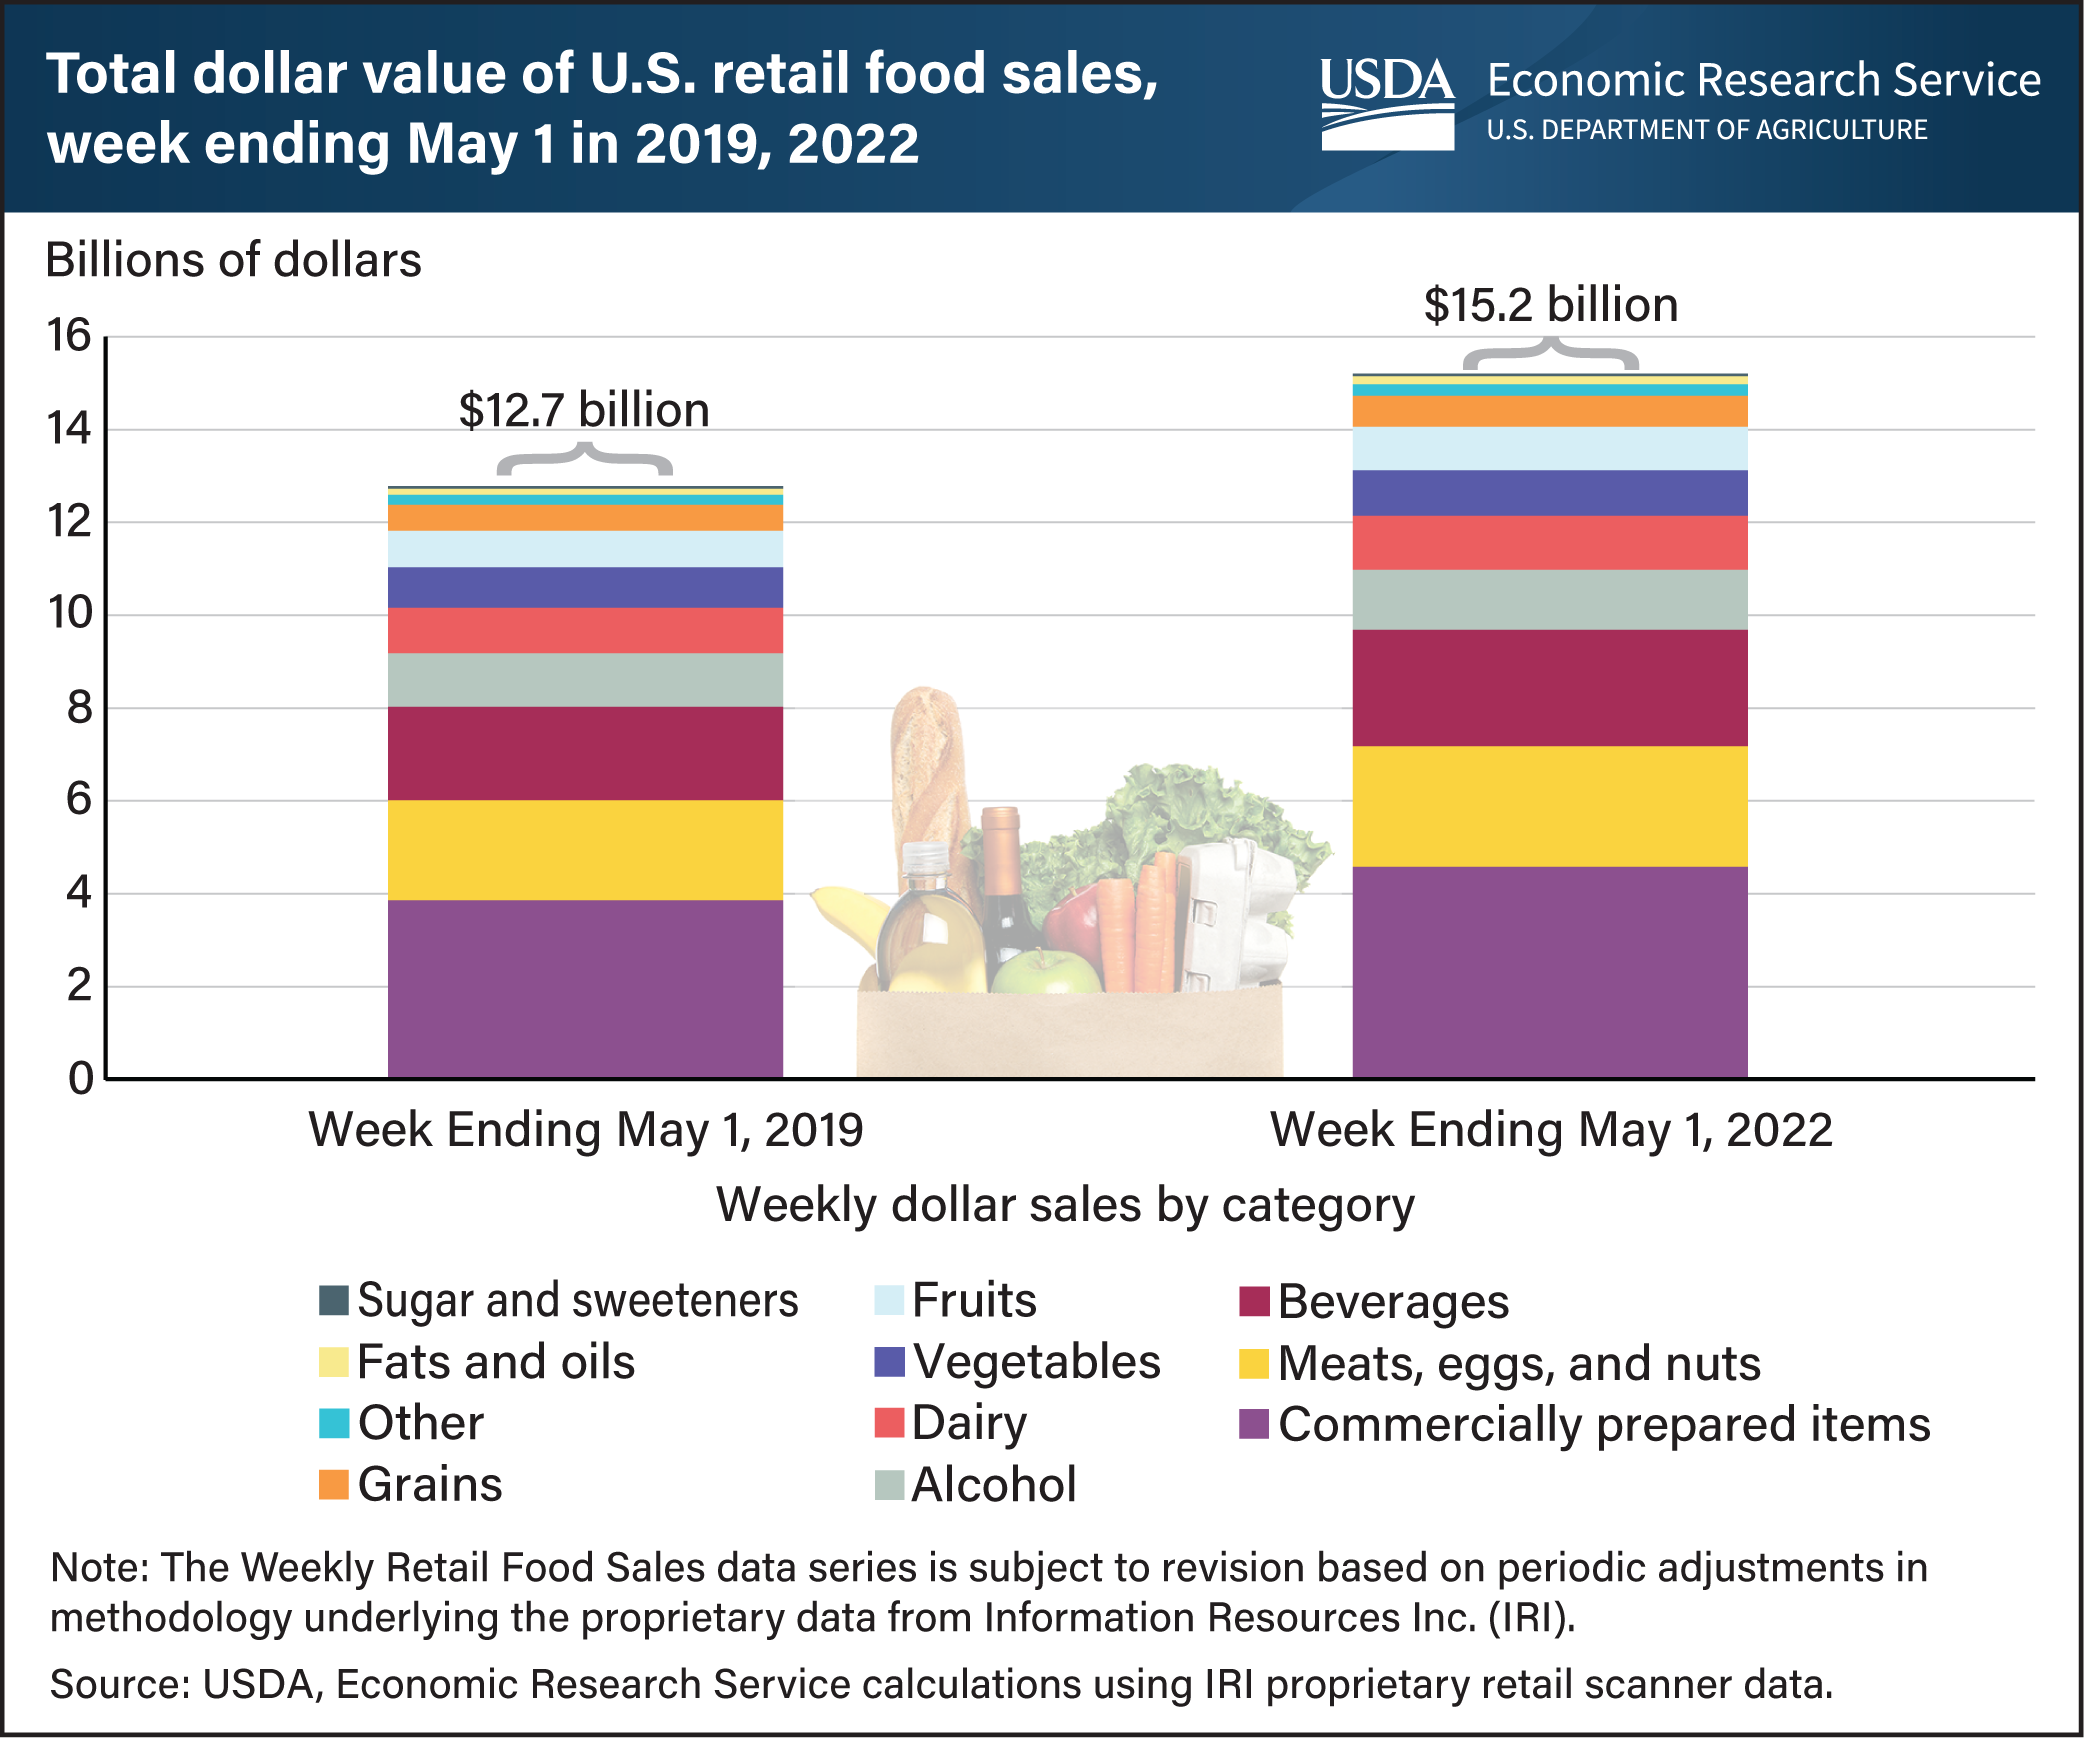
Total retail food sales in the United States were higher the week ending May 1, 2022, $15.2 billion, compared with May 1, 2019, $12.7 billion, with substantial variation among categories. During the same period, the share of meats, eggs, and nuts increased from 16.8 percent to 17.1 percent, while the share of vegetables fell from 6.8 percent to 6.4 percent. The largest 3-year change was for fats and oils, which were 25.5 percent higher in sales value in 2022 compared with 2019. While the smallest 3-year change was for alcohol, which was 12.3 percent higher in sales value in 2022 compared with 2019. The USDA, Economic Research Service’s (ERS) Weekly Retail Food Sales data product provides a current and detailed picture of U.S. food-at-home retail sales. These data are clustered to food group levels and representative at the national and State levels. Two publicly available sets of the Weekly Retail Food Sales data are updated monthly by ERS: One with national totals and totals by 51 product subcategories (including alcohol), and the other with State totals for 39 States by 10 product categories (including alcohol). The data for this chart are available in ERS’s Weekly Retail Food Sales data product, updated on May 31, 2022.