
Spending dropped at all types of food-away-from-home outlets in first year of COVID-19 pandemic
- by Wilson Sinclair and Eliana Zeballos
- 5/18/2022
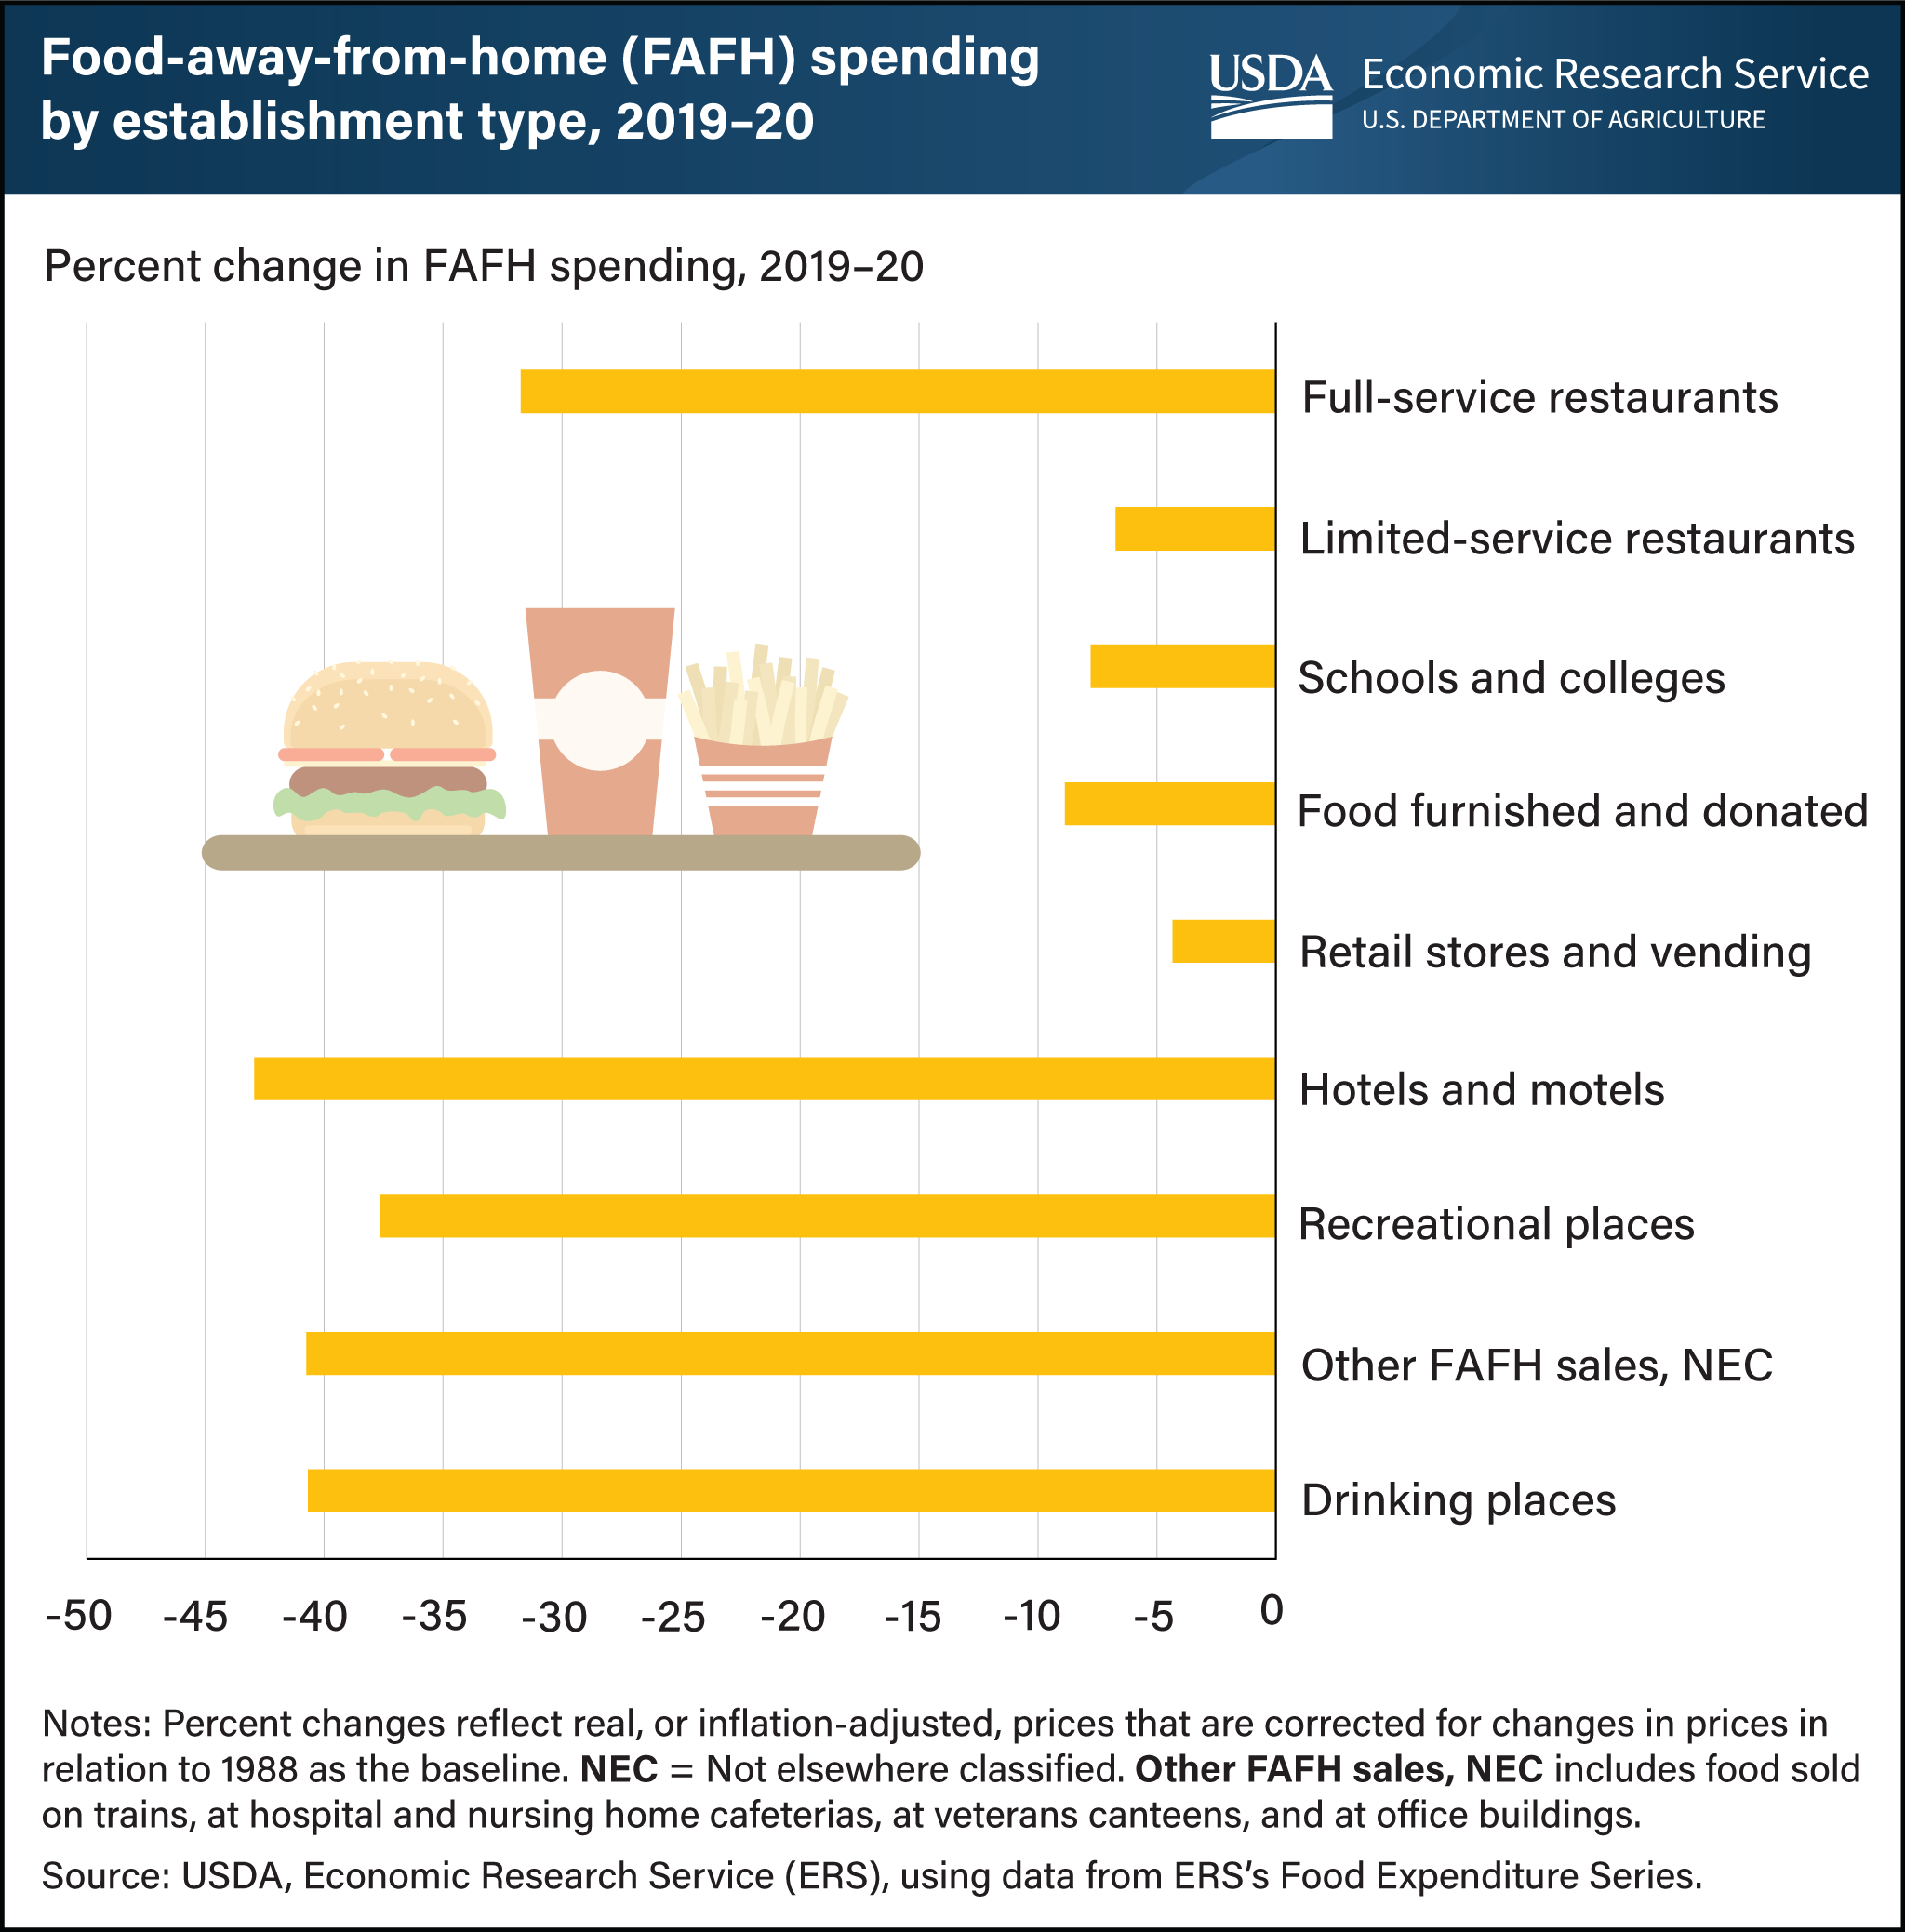
Spending decreased at each of the nine types of food-away-from-home (FAFH) outlets measured in the USDA, Economic Research Service’s Food Expenditure Series (FES) from 2019 to 2020. Although existing infrastructure, such as drive-through services, enabled limited-service restaurants to comply with Coronavirus (COVID-19) pandemic safety measures, these establishments still saw a 6.7-percent decline in annual spending. Full-service restaurants, which accounted for more FAFH spending than all other outlets from 1997 to 2019, experienced a decrease in spending of 31.7 percent in 2020. This was partly due to pandemic-related closures during some of the year. Hotels and motels, recreational places, and drinking places also experienced closures and capacity restrictions throughout much of 2020. Food spending fell 42.9 percent at hotels and motels, 37.7 percent at recreational places, and 40.7 percent at drinking places. Food expenditures at schools and colleges dropped 7.8 percent in 2020. The 2021 annual FES data will be released in June 2022 and will provide an update on these trends as well as other food spending data. This chart uses the FES data and appears in the ERS’s Amber Waves article, “Food Spending by U.S. Consumers Fell Almost 8 Percent in 2020”, October 2021.