
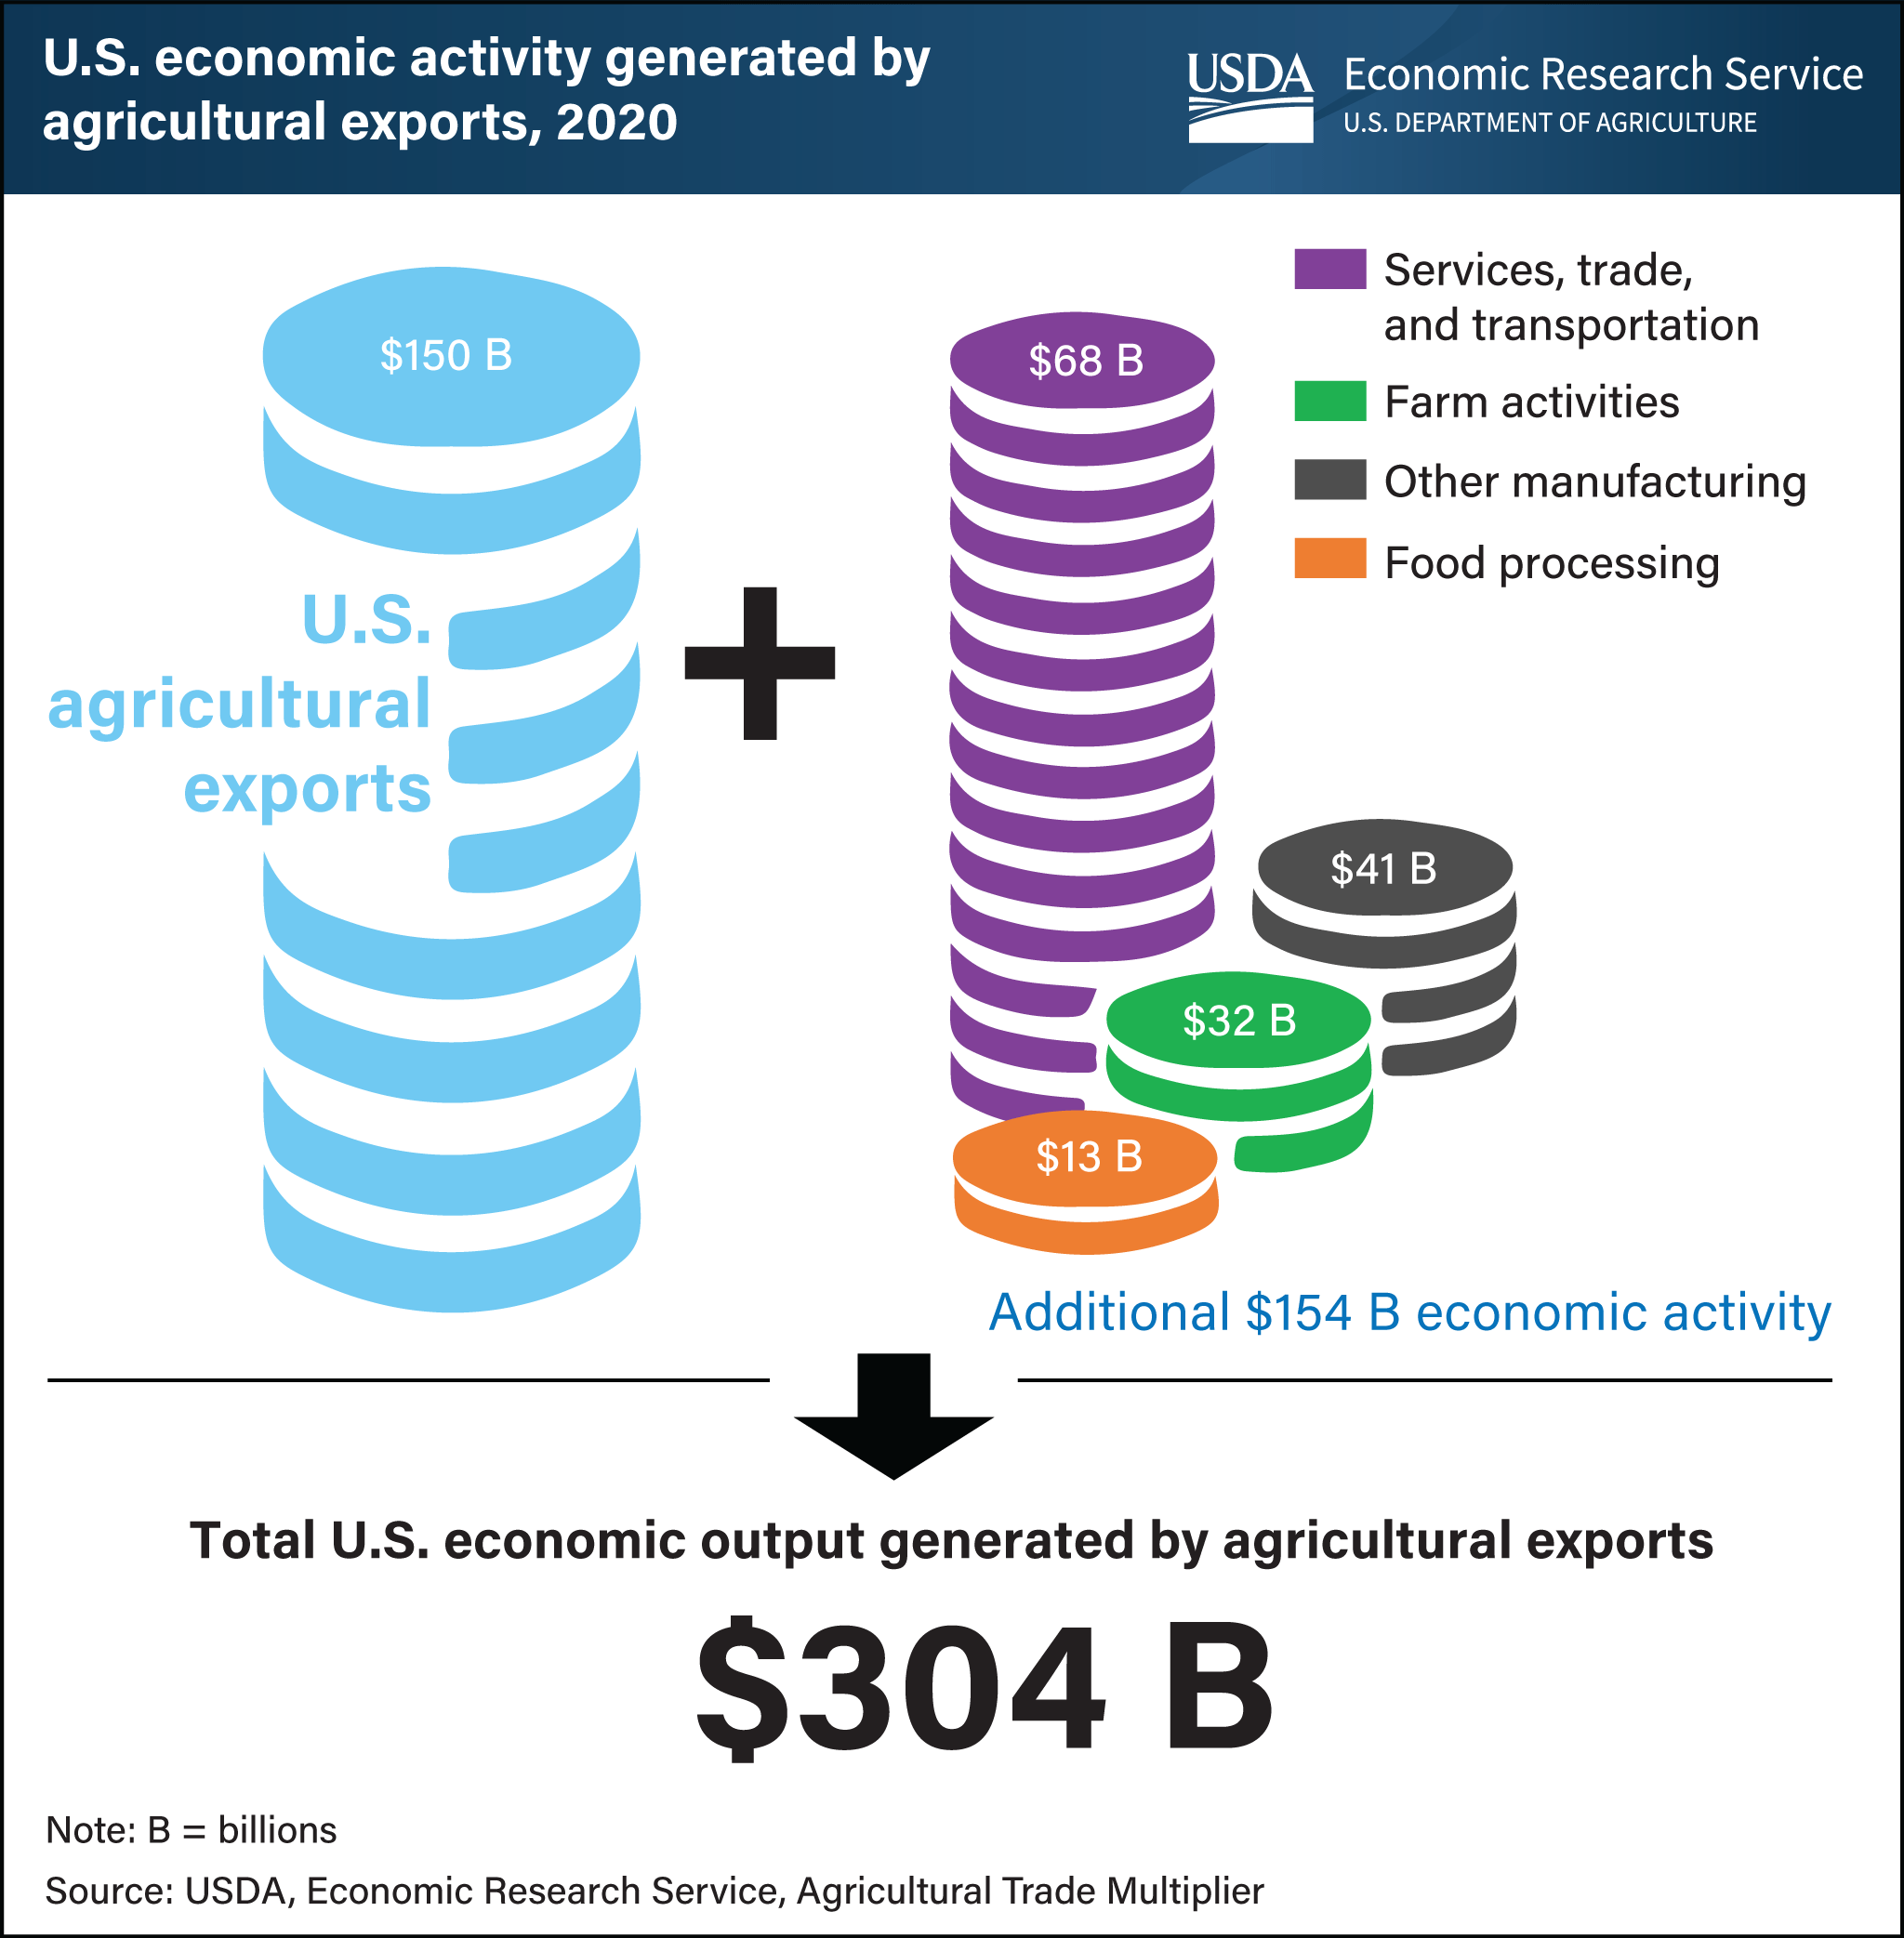
U.S. agricultural exports of $150 billion generated an additional $154 billion for the U.S. economy in 2020
- by Wendy Zeng
- 3/4/2022
Errata: On March 8, 2022, the graphic presented in this Chart of Note was revised to better represent the differences between the dollar amounts of the economic activities.
Exports constitute a significant market for U.S. farm and food products and send ripples of activity through the nation’s economy. For instance, exports of grain first generate economic activity on the farm through purchases of inputs such as fuel and fertilizer, spurring additional economic activity in the manufacturing, trade, and transportation sectors. Getting the grain to the export market requires transportation, storage, and marketing, among many other services. This additional economic activity is estimated annually by USDA’s Economic Research Service (ERS) using an agricultural trade multiplier that measures the employment and output effects of trade in farm and food products on the U.S. economy. Despite the onset of the Coronavirus (COVID-19) pandemic in 2020, which depressed foreign sales for several months, exports rebounded starting in August and increased significantly afterward. U.S. agricultural exports valued at $150 billion in 2020 generated an additional $154 billion in economic activity, for a total of $304 billion in economic output. This means that on average, every $1 of U.S. agricultural product exported generated a total $2.03 of domestic economic activity. No sector outside of crop and livestock production benefited more from agricultural exports than the services, trade, and transportation sector, which generated $68 billion worth of additional economic activity. On the farm, agricultural exports supported an additional $32 billion of business activity beyond the value of the agricultural exports themselves. This chart is drawn from ERS’s Agricultural Trade Multiplier, released February 2022. See also the Amber Waves infographic, 2020 U.S. Agricultural Trade Multiplier for Soybeans.
We’d welcome your feedback!
Would you be willing to answer a few quick questions about your experience?