

Record U.S. agricultural exports in FY 2021 spurred by East Asian and North American sales of grains and oilseeds
- by James Kaufman and Bart Kenner
- 2/25/2022
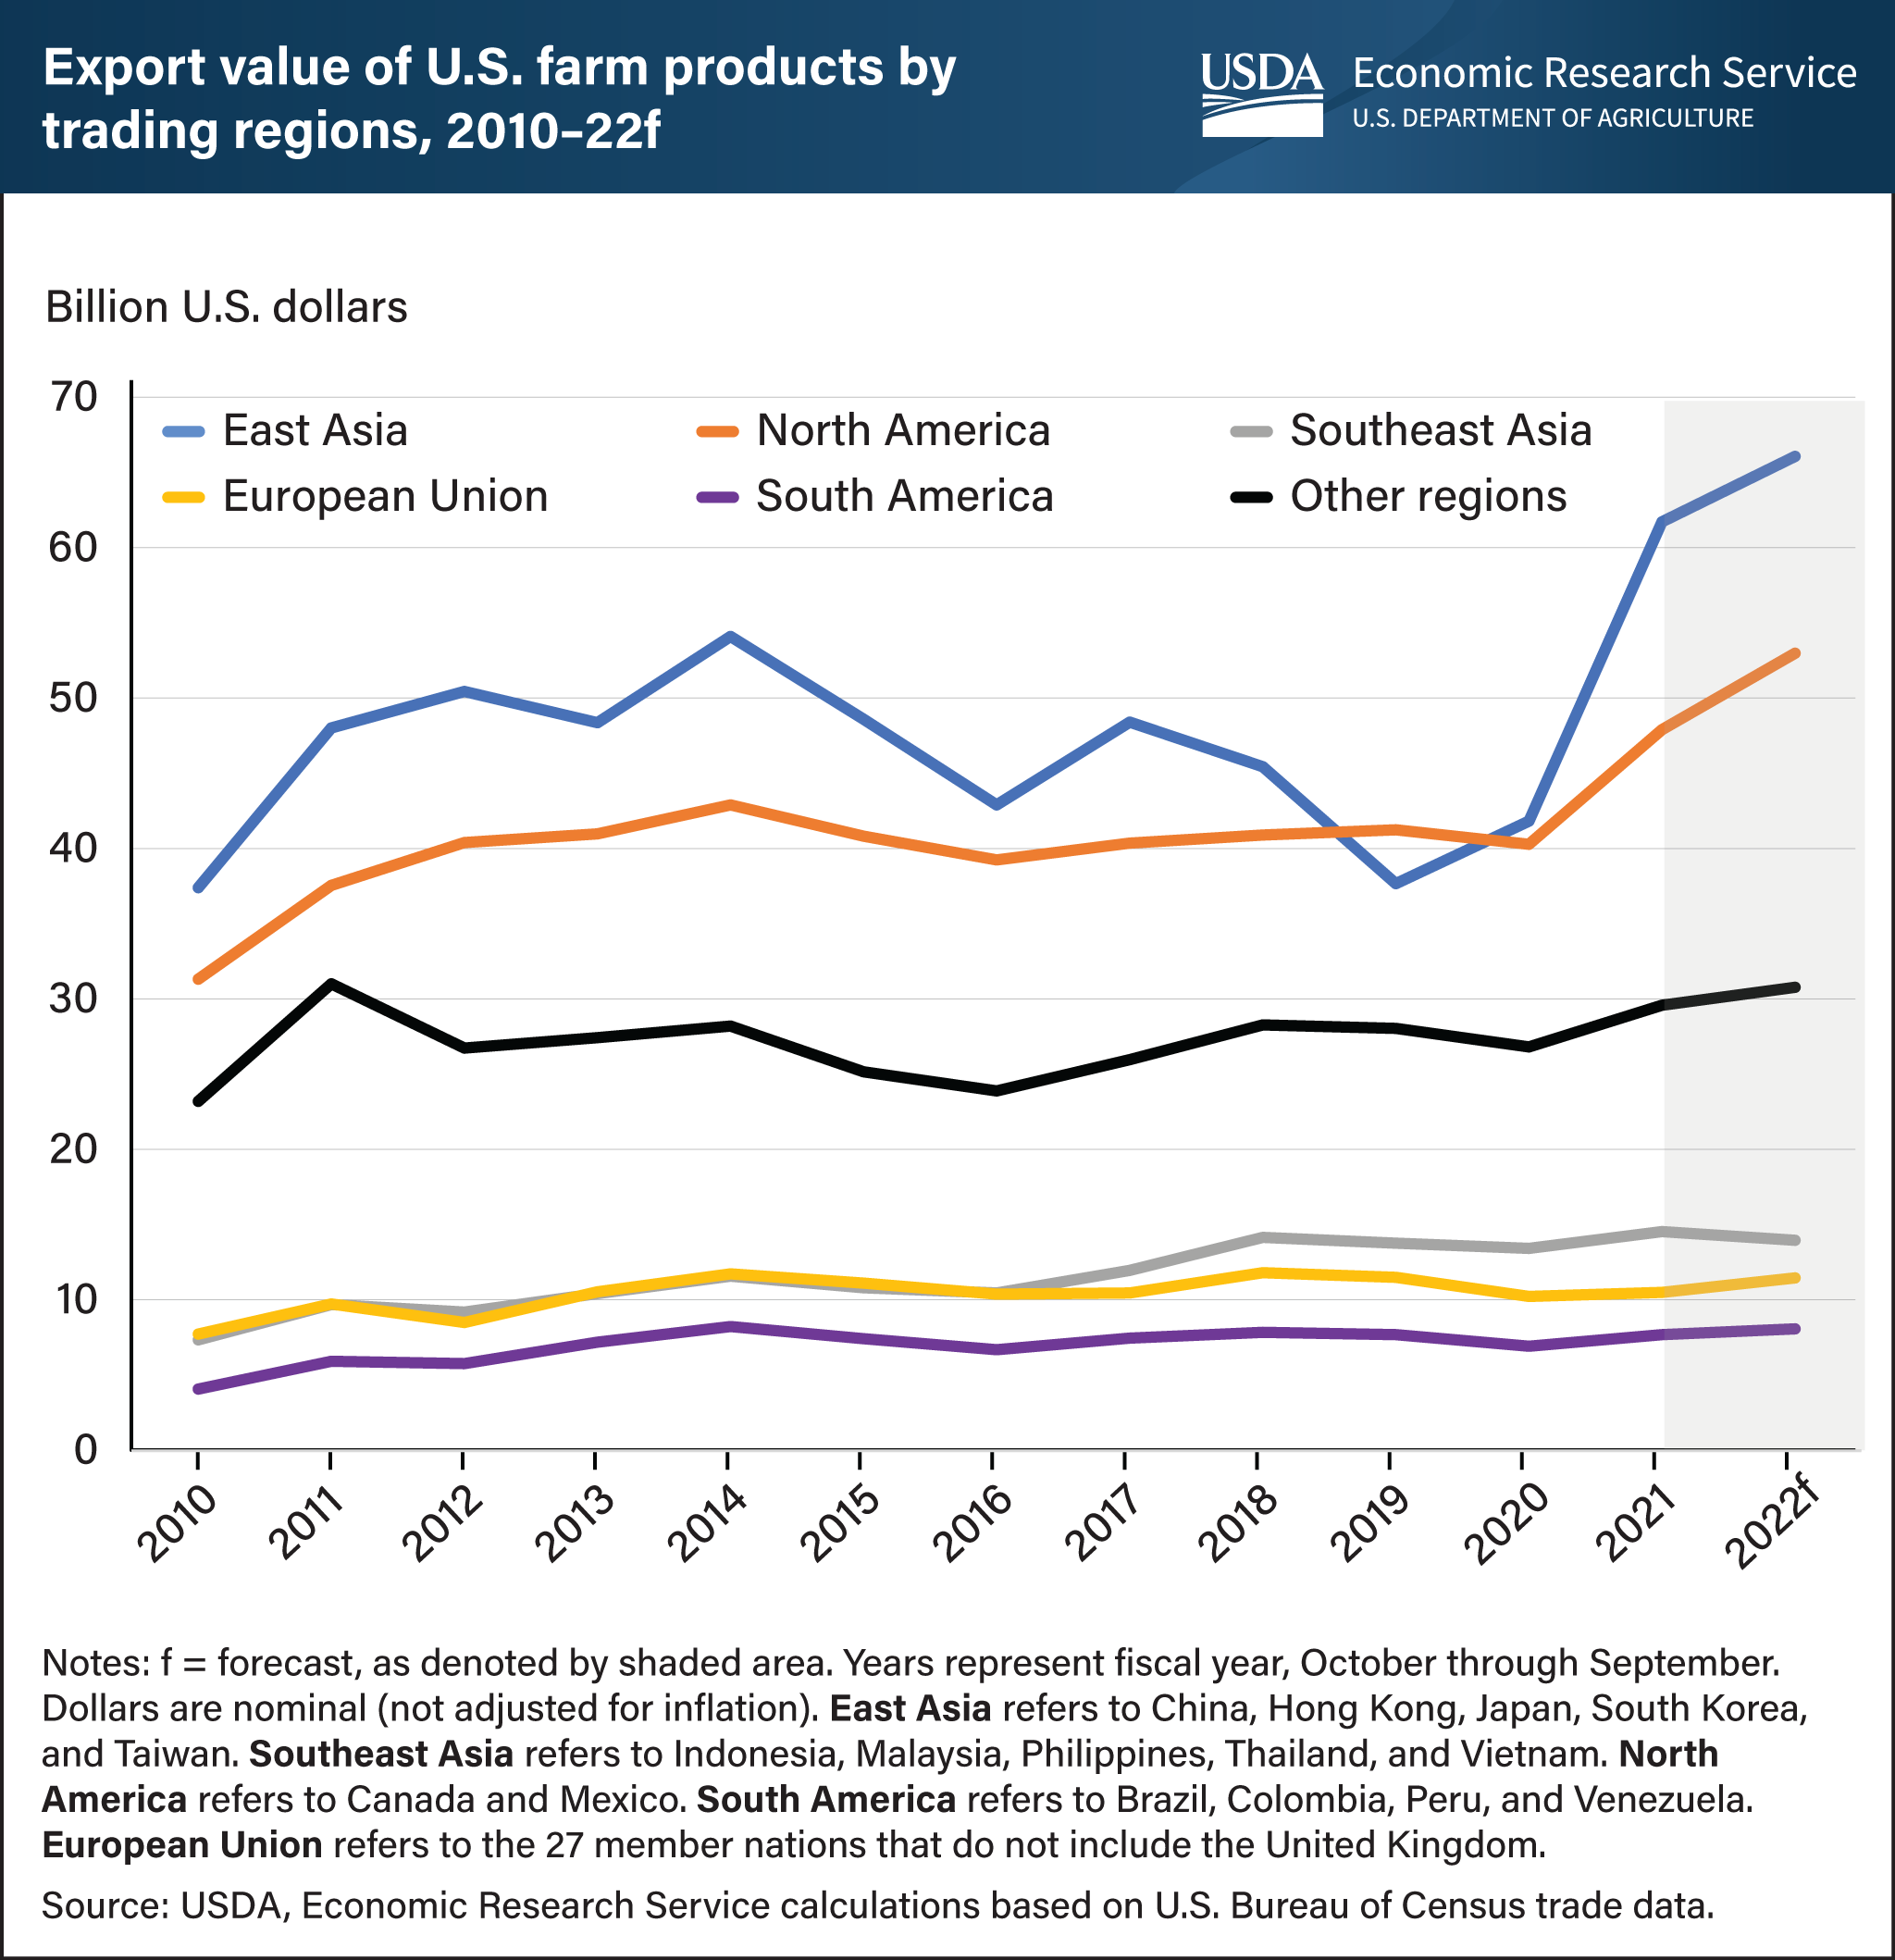
At more than $172 billion, the total value of U.S. agricultural exports reached a high in fiscal year (FY) 2021. Values are projected to remain elevated in FY 2022 (October–September) with the current forecast at $183.5 billion. Exports grew in most trading regions, although East Asia (China, Japan, Hong Kong, Taiwan, and South Korea) recently has accounted for the largest share. Exports to East Asia slipped during the 2010s, from a high of $54 billion in 2014 to a low of $37.7 billion in 2019. Since 2019, exports rebounded to $61.7 billion in 2021, of which China accounts for 54 percent and Japan 22 percent, and are forecast to exceed $66 billion in FY 2022. Much of the growth in East Asian exports was associated with higher consumption of grains and oilseeds as China rebuilds its pork industry after devastation caused by African swine fever. U.S. sales to North American trading partners provided the second largest contribution to U.S. agricultural export growth. Abundant U.S. corn supplies supported the increases in grain and feed exports, especially to Mexico. In 2021, grain and feed exports to Mexico and Canada rose to $11.8 billion. Agricultural exports to the next largest trading regions—Southeast Asia and the European Union (EU)—were comparatively flat, with both grain and oilseed exports to the EU down in 2020 and 2021. This chart is drawn from data in USDA, Economic Research Service’s (ERS) Outlook for U.S. Agricultural Trade and data in ERS's U.S. Agricultural Trade Update.