
U.S. labor productivity per hours worked grew from 1948 to 2017 in part because of changes in quality of labor, study finds
- by Sun Ling Wang
- 2/16/2022
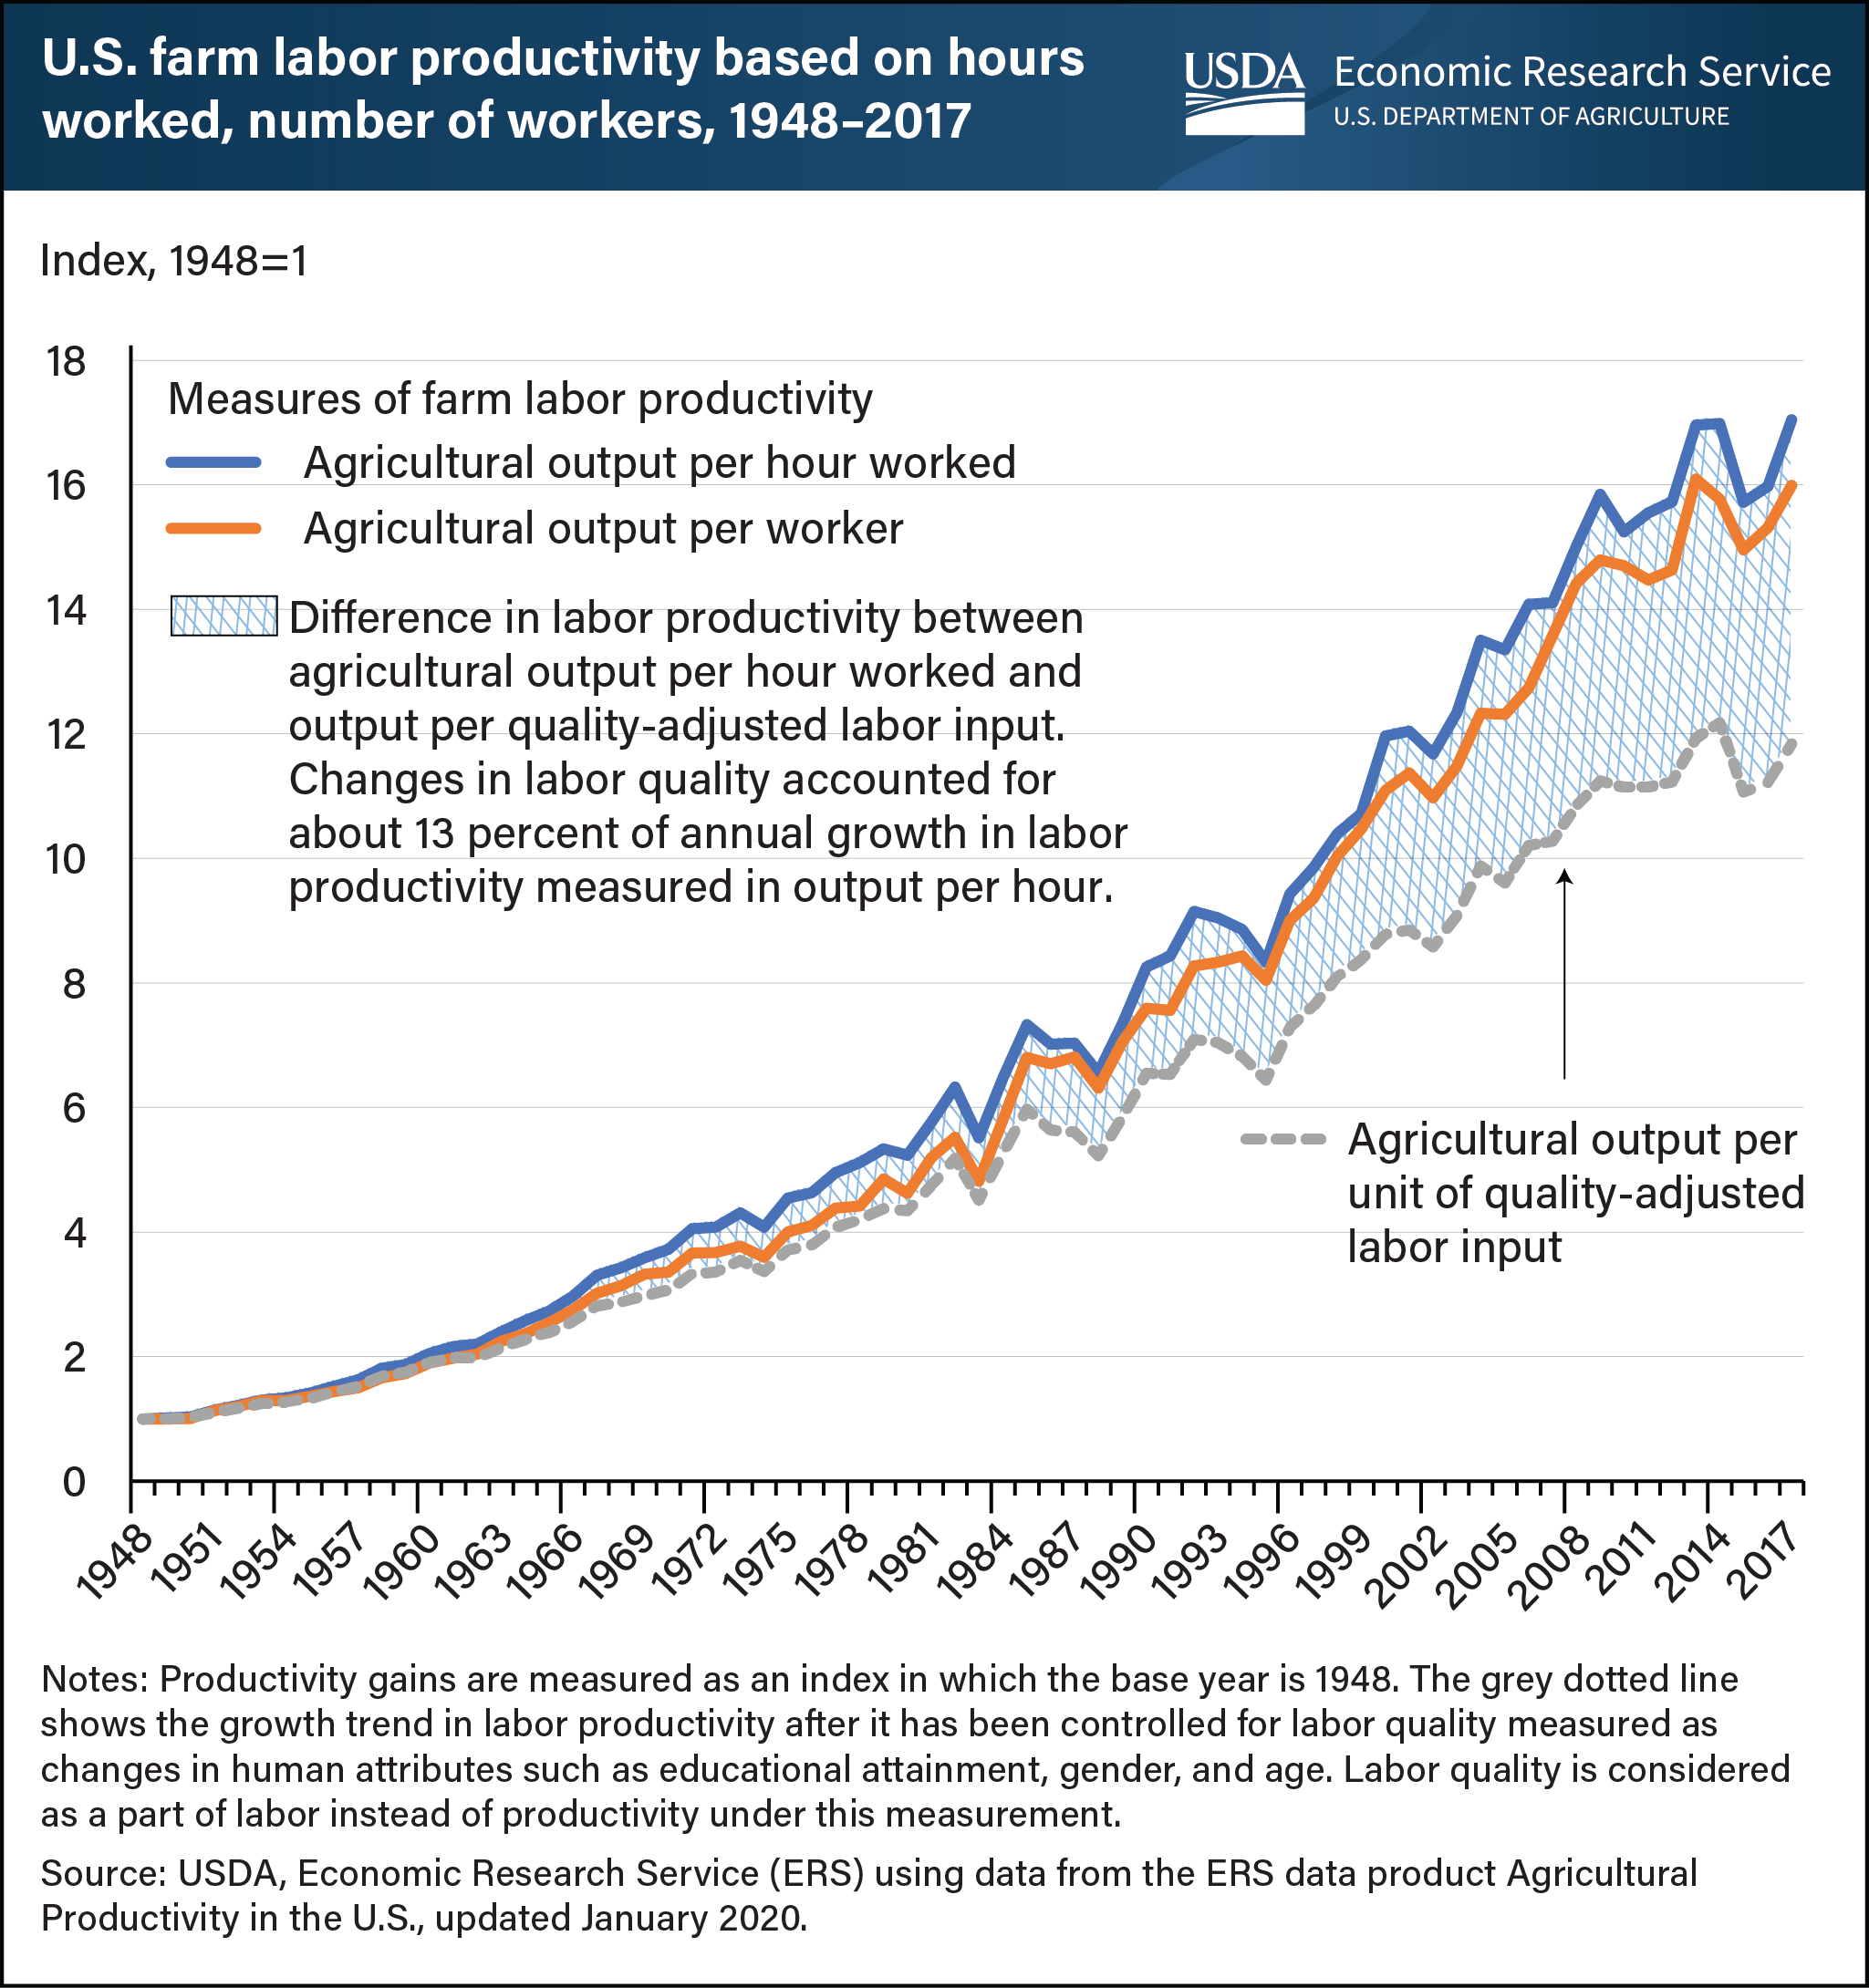
Agricultural output in the United States nearly tripled between 1948 and 2017 even as the amount of labor hours-worked declined by more than 80 percent. These opposing trends resulted in an increase in labor productivity growth in the U.S. farm sector. Labor productivity—calculated as average output per unit of labor input—is a popular measure for understanding economic growth. According to USDA, Economic Research Service (ERS) estimates, agricultural output per worker grew by 16 times from 1948 through 2017. At the same time, agricultural output per hour worked grew even faster, by 17 times, implying that average hours worked per worker declined. Labor productivity estimates can vary based on different ways labor is measured. One factor in the increased labor productivity is the quality of labor, measured by attributes such as age, gender, and the highest level of education a worker has reached. Because these attributes may affect worker performance, ERS researchers accounted for labor quality changes in analyzing farm labor productivity. When labor quality changes since 1948 were accounted for, labor productivity grew at a slower rate than those based simply on hours worked or employment. The reason is because labor quality is treated as a part of labor input instead of productivity. This implies that changes in labor quality, such as improvements in education, account for much of the change in labor productivity over the last seven decades. ERS researchers estimate that changes to farm worker attributes accounted for about 13 percent of growth in hourly based annual labor productivity during the time studied. This chart in included in the ERS report Farm Labor, Human Capital, and Agricultural Productivity in the United States, published Feb. 15, 2022.