

U.S. per capita fluid cow’s milk consumption slid further during the 2010s
- by Hayden Stewart and Fred Kuchler
- 1/31/2022
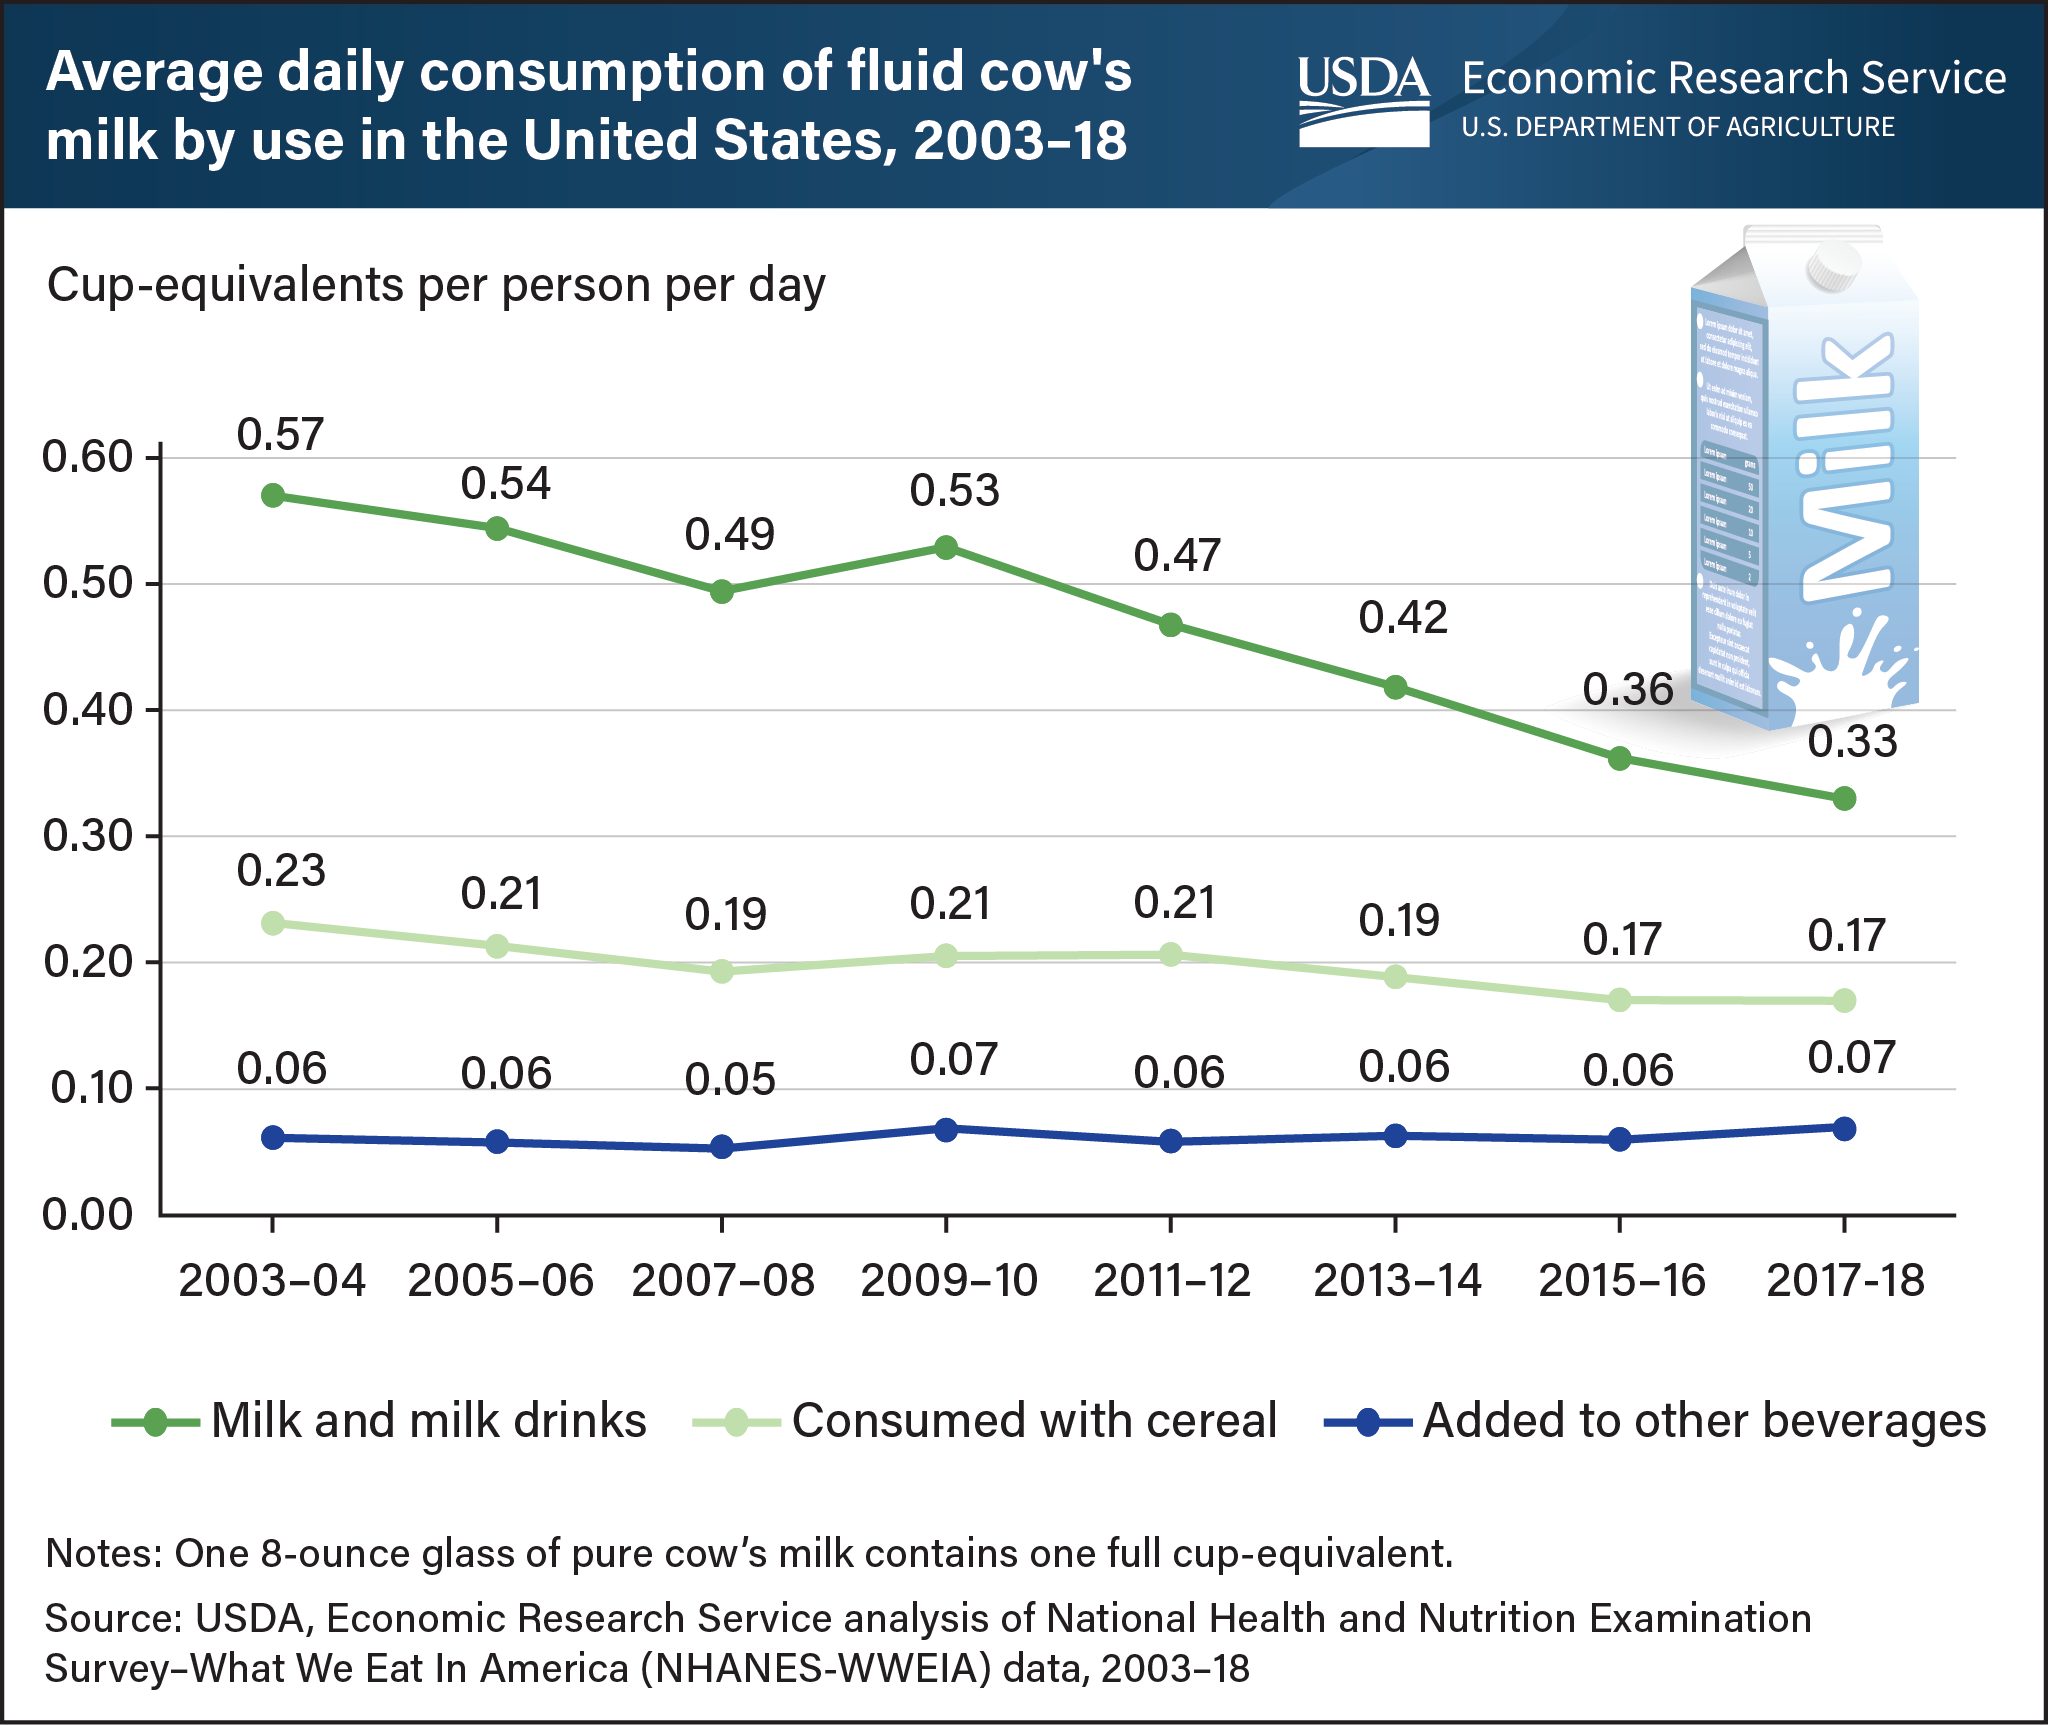
U.S. per capita consumption of fluid cow’s milk has been trending downward since about the mid-1940s, and it fell at a faster rate during the 2010s than in each of the previous six decades. Using dietary intake surveys collected between 2003 and 2018, USDA, Economic Research Service (ERS) researchers examined recent trends in milk consumption by looking at how individuals consumed the milk and consumers’ ages. Results confirmed that drinking milk as a beverage is the primary way that individuals of all ages consume fluid cow’s milk. These beverages include plain and flavored fluid milk as well as malted milk, eggnog, kefir, hot chocolate, and other milk-based beverages. On a given day in 2003–04, U.S. consumers drank about 0.57 cup-equivalents of fluid cow’s milk on average. Per person consumption of milk as a beverage fluctuated over the 2000s between 0.53 and 0.57 cup-equivalents per day. However, it declined over the 2010s, falling to 0.33 cup-equivalents in 2017–18. Over the study period, U.S. per person consumption of milk with cereal also fell by 0.06 cup-equivalents, with the steepest drop in consumption occurring among children. No significant changes were detected in the amount of milk that U.S. consumers pour into other, non-dairy beverages such as tea and coffee. This chart appears in the ERS report Examining the Decline in U.S. Per Capita Consumption of Fluid Cow’s Milk, 2003–18, released October 2021.