

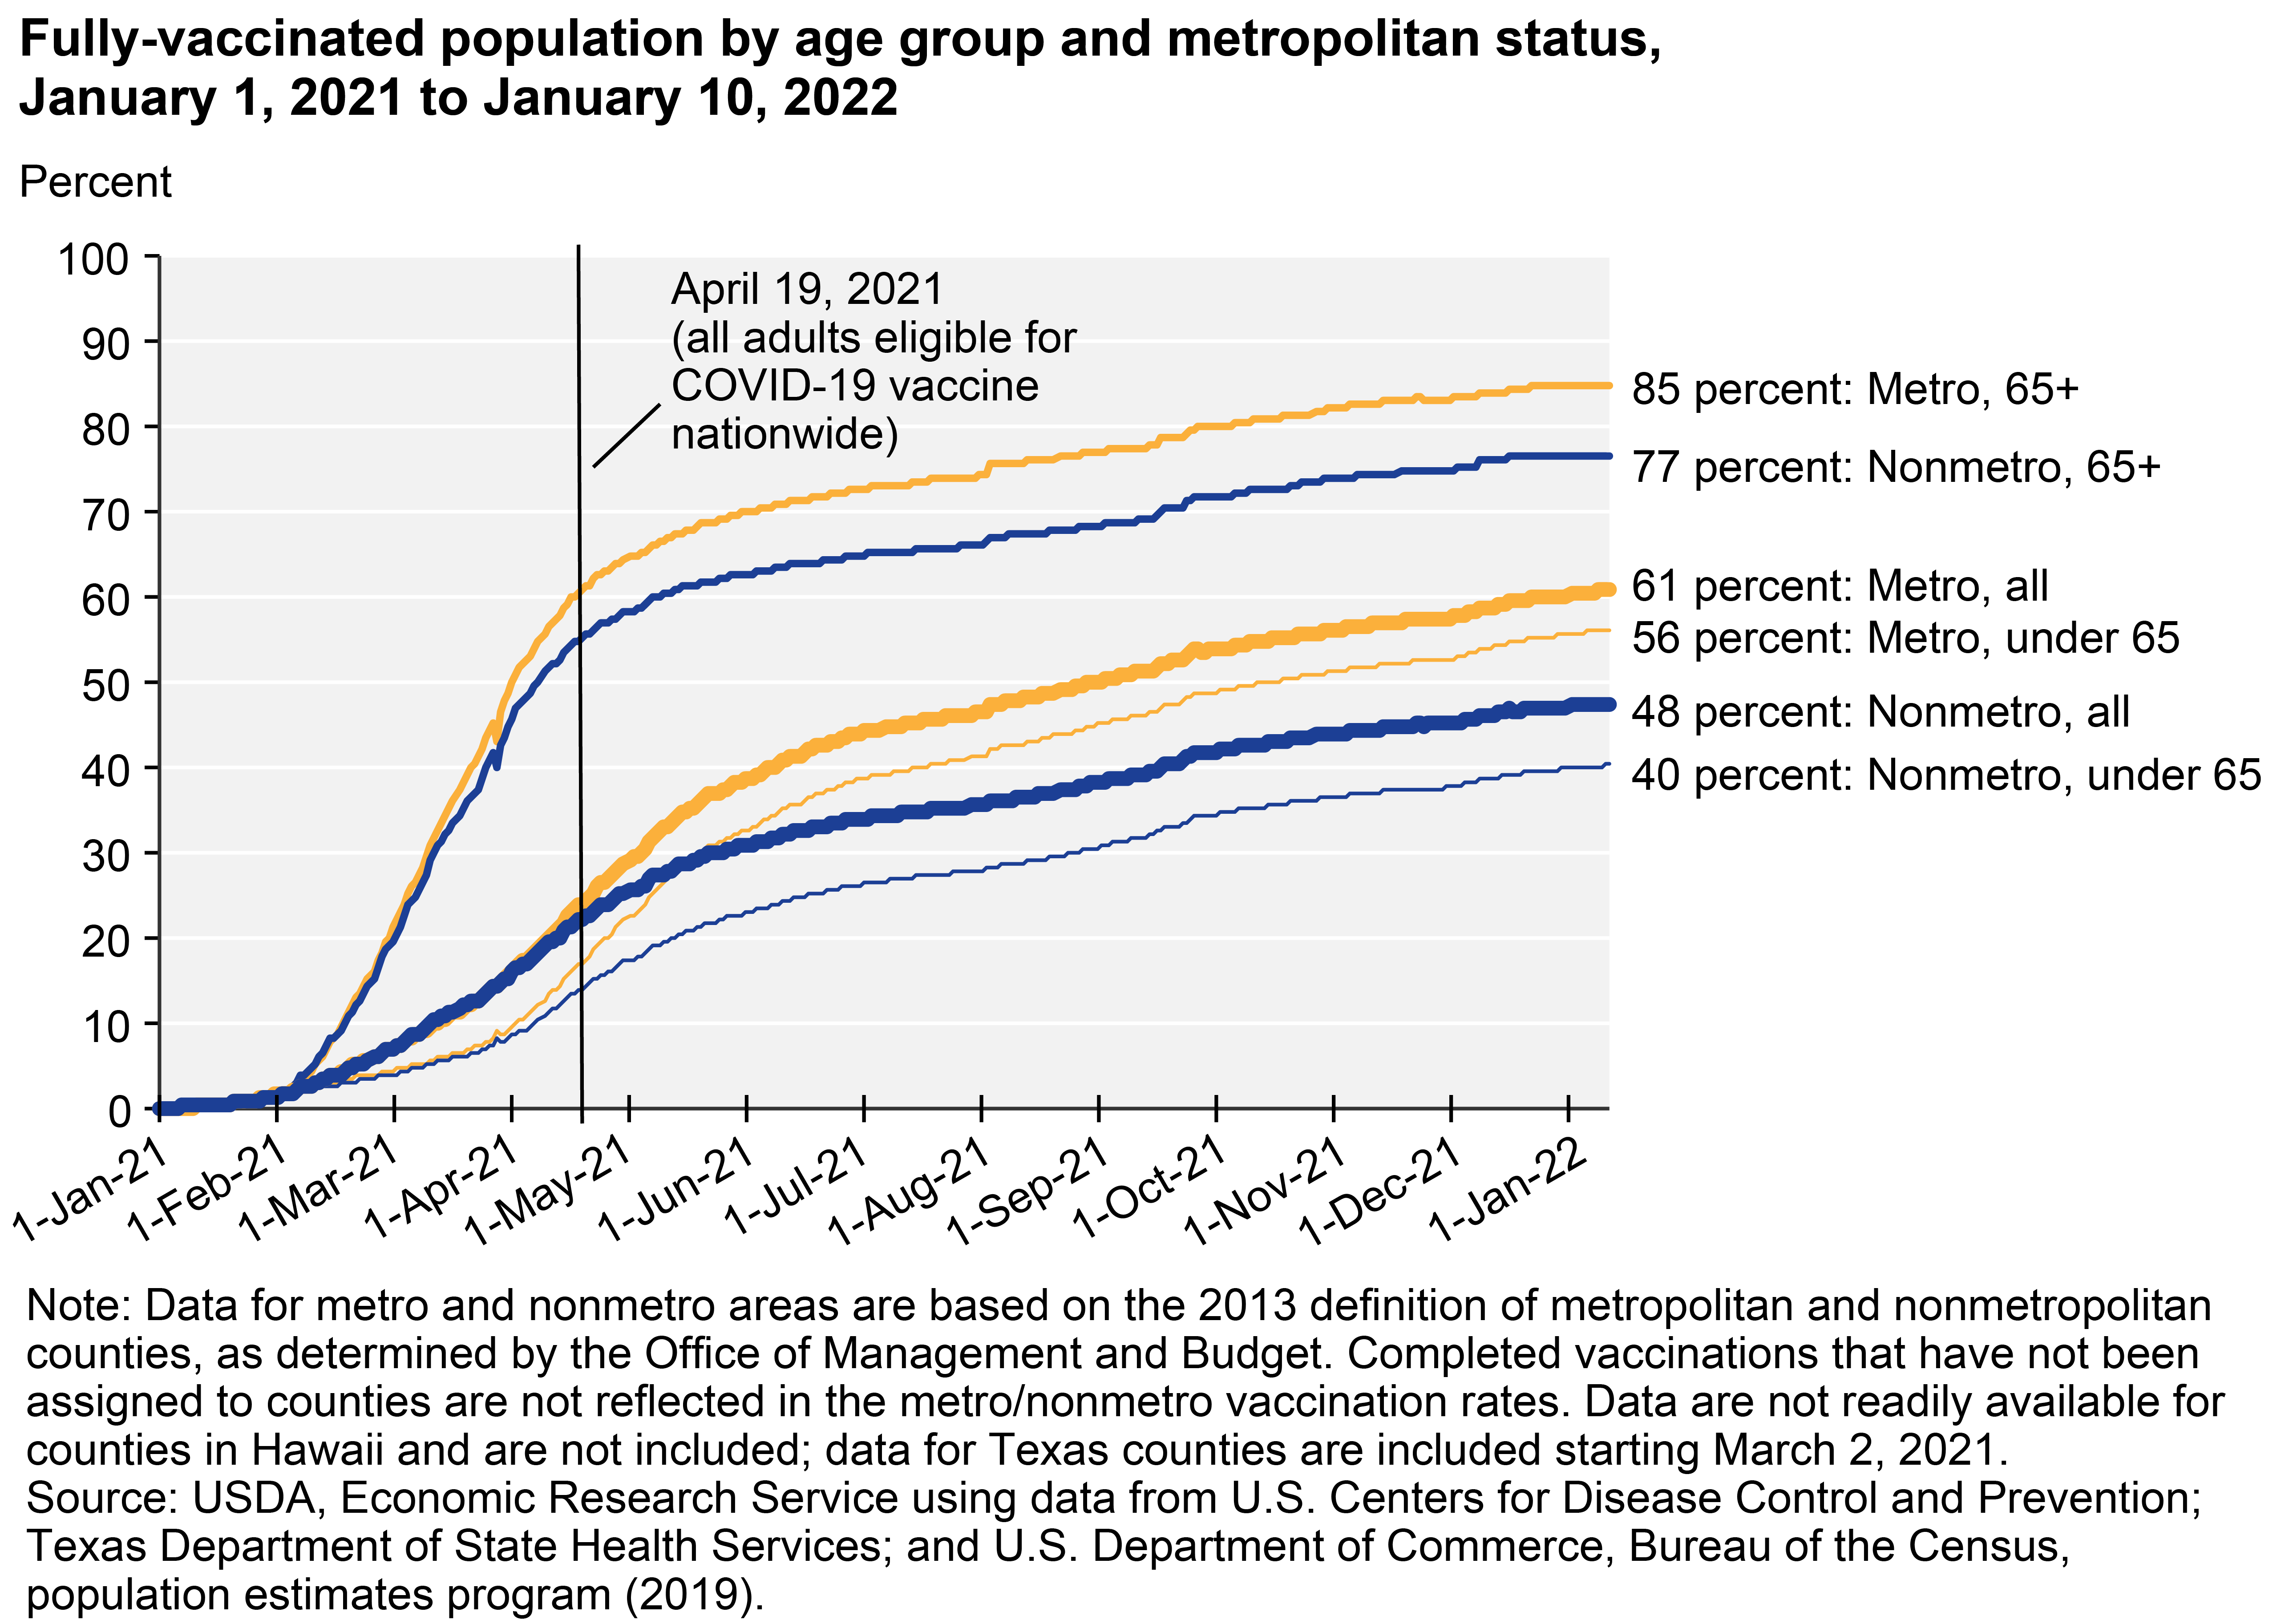
Fully-vaccinated population by age group and metropolitan status, January 1, 2021 to January 10, 2022
- by Austin Sanders
- 1/21/2022
Download chart image | Chart data
Fully-vaccinated population by age group and metropolitan status, January 1, 2021 to January 10, 2022