
U.S. fluid milk availability continued to decline in 2019; share grew for low-fat options over last 40 years
- by Andrzej Blazejczyk
- 1/10/2022
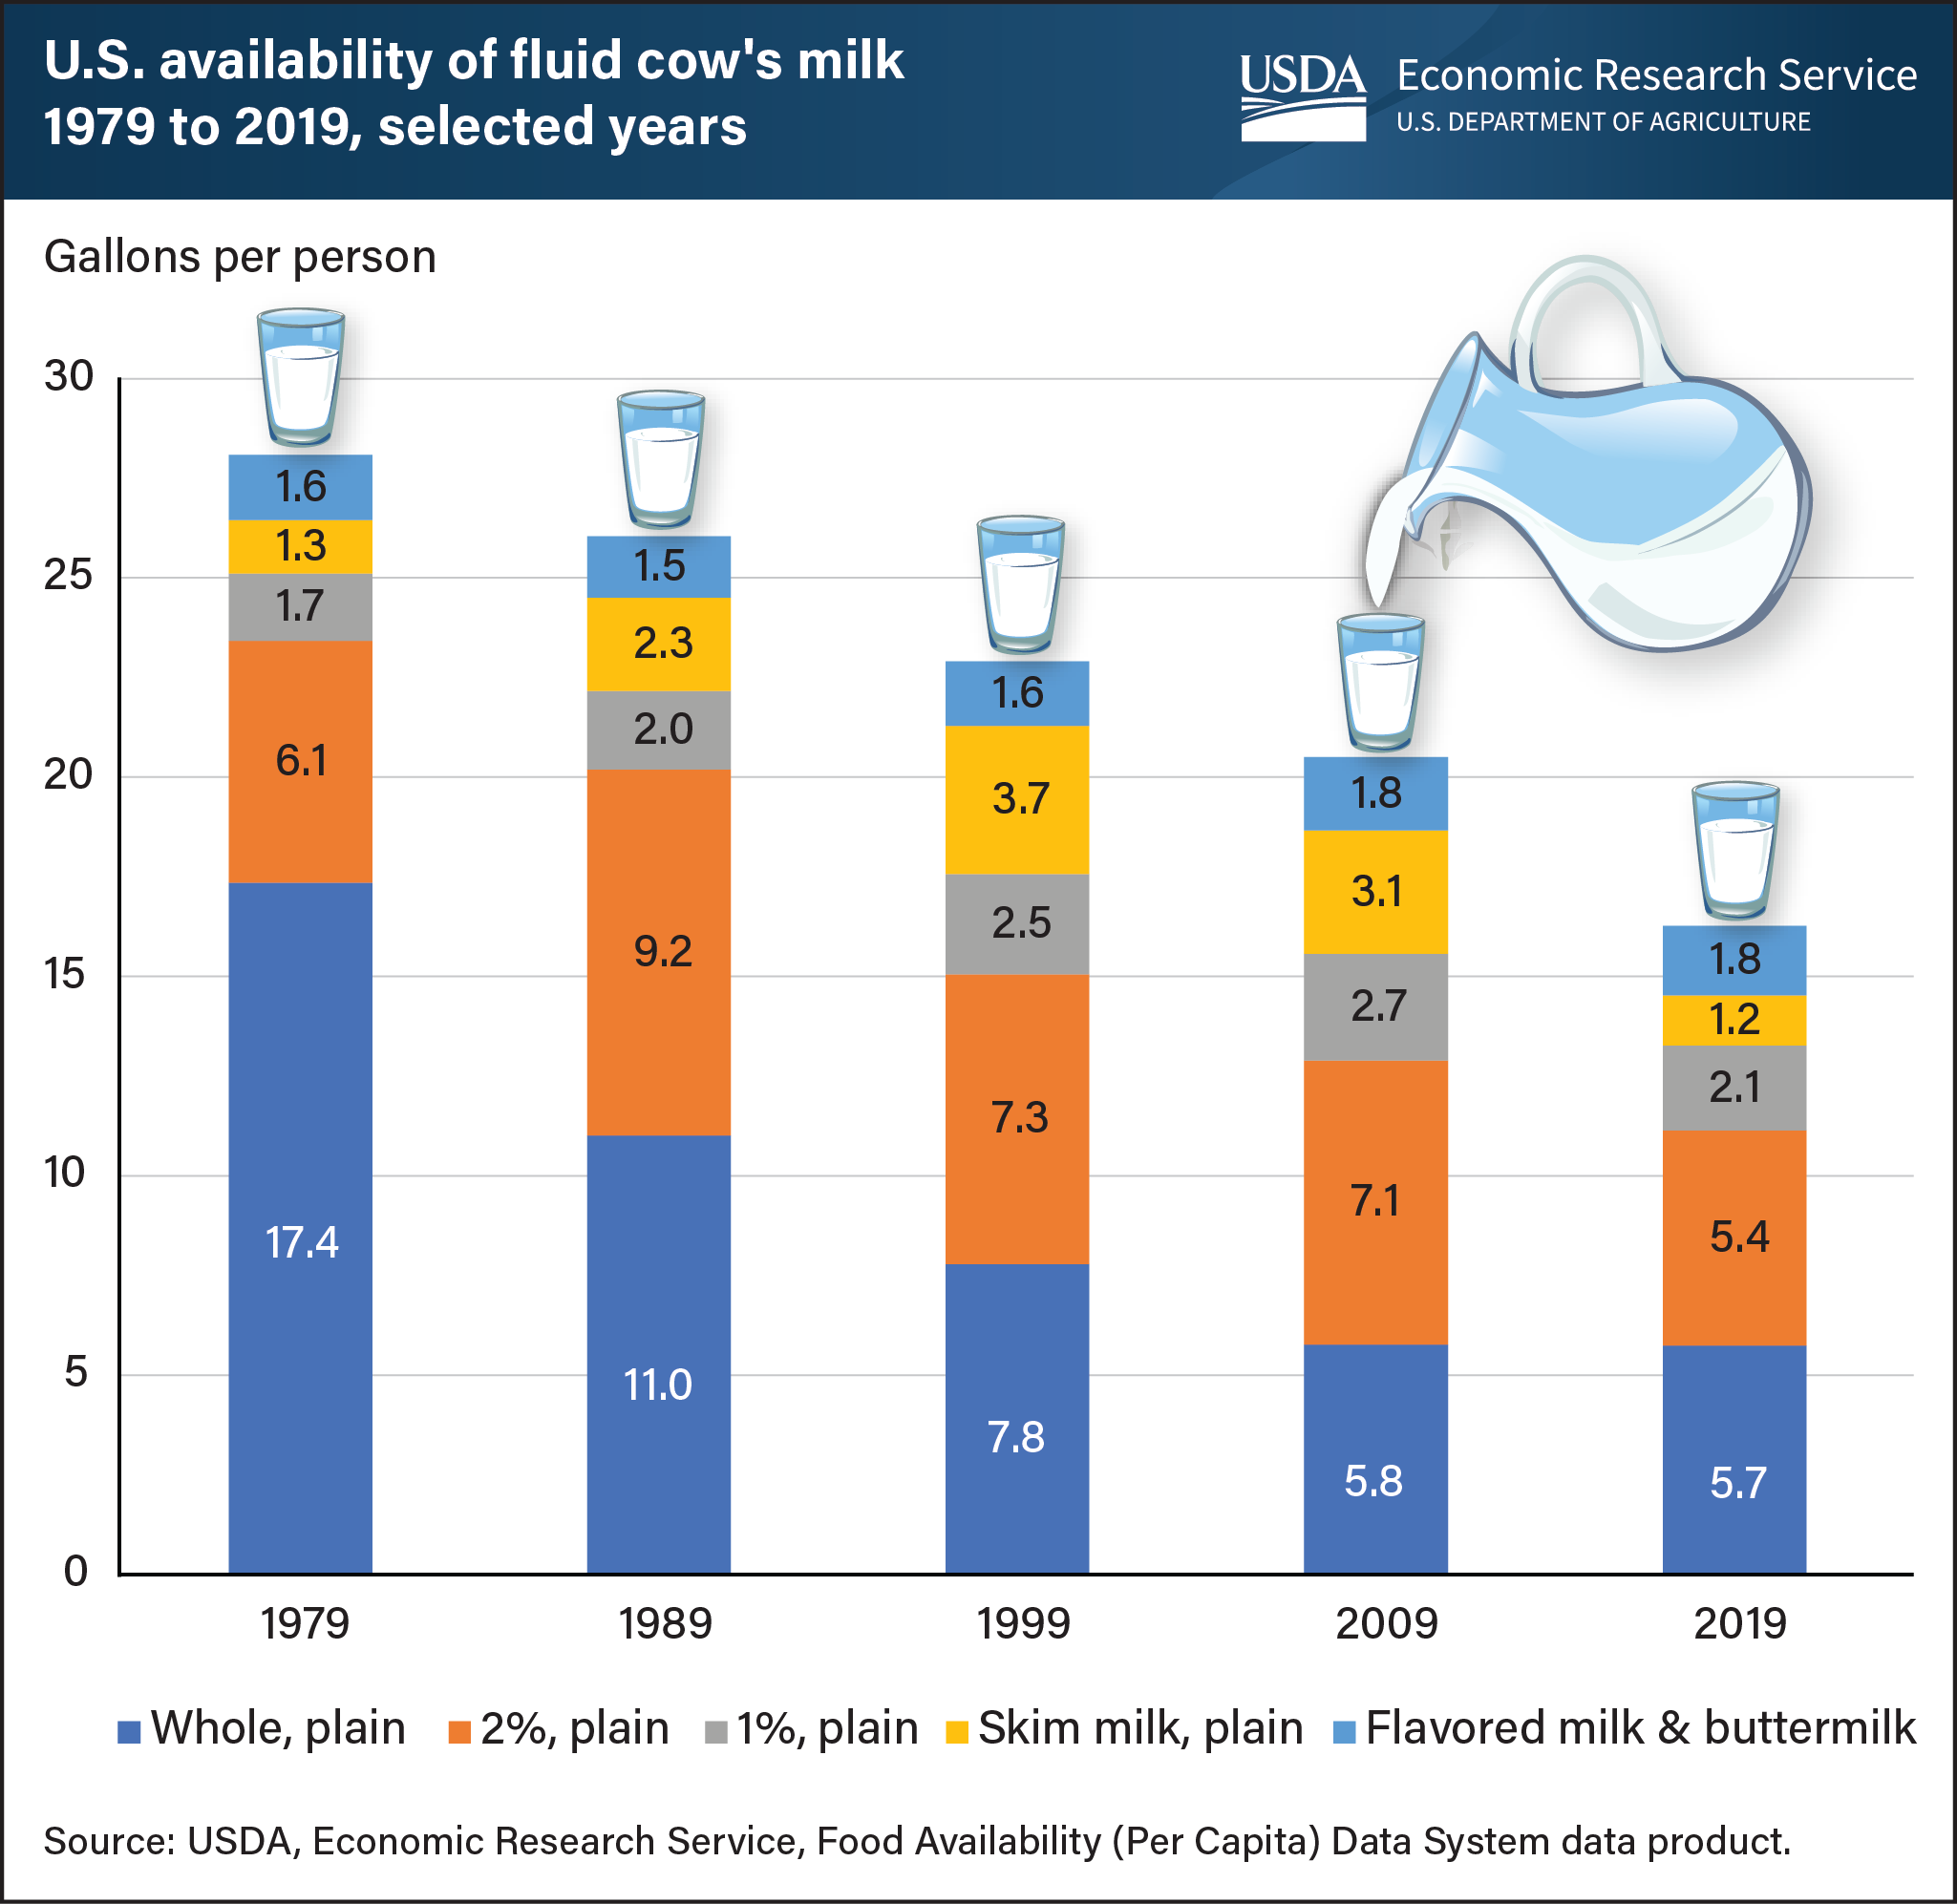
The supply of fluid cow’s milk available for U.S. consumers to drink decreased by 42 percent from 1979 to 2019, from 28.1 gallons per person to 16.3 gallons, according to USDA, Economic Research Service (ERS) food availability data. Whole milk availability drove this decline, falling nearly 67 percent to 5.7 gallons per person in 2019 from 17.4 gallons in 1979. The amount of low-fat, skim, and 1 percent milk available for U.S. consumption grew slightly over the last 40 years to a combined 3.3 gallons per person in 2019 from 3.0 gallons in 1979. Availability of 2 percent milk initially grew from 6.1 gallons per person in 1979 to a high of 9.2 gallons in 1989 before falling to 5.4 gallons in 2019. Whole milk was replaced by 2 percent milk as the most consumed milk type in 2005. Availability of flavored milk and buttermilk remained relatively steady over the last four decades, totaling 1.8 gallons per person in 2019. Several factors affect trends in U.S. per person milk availability, including competition from alternative beverages, an aging population, and changing consumer attitudes and preferences regarding milk fats. The data for this chart come from the ERS Food Availability (Per Capita) Data System.
We’d welcome your feedback!
Would you be willing to answer a few quick questions about your experience?