

Data show U.S. poverty rates in 2019 higher in rural areas than in urban for racial/ethnic groups
- by Tracey Farrigan
- 8/23/2021
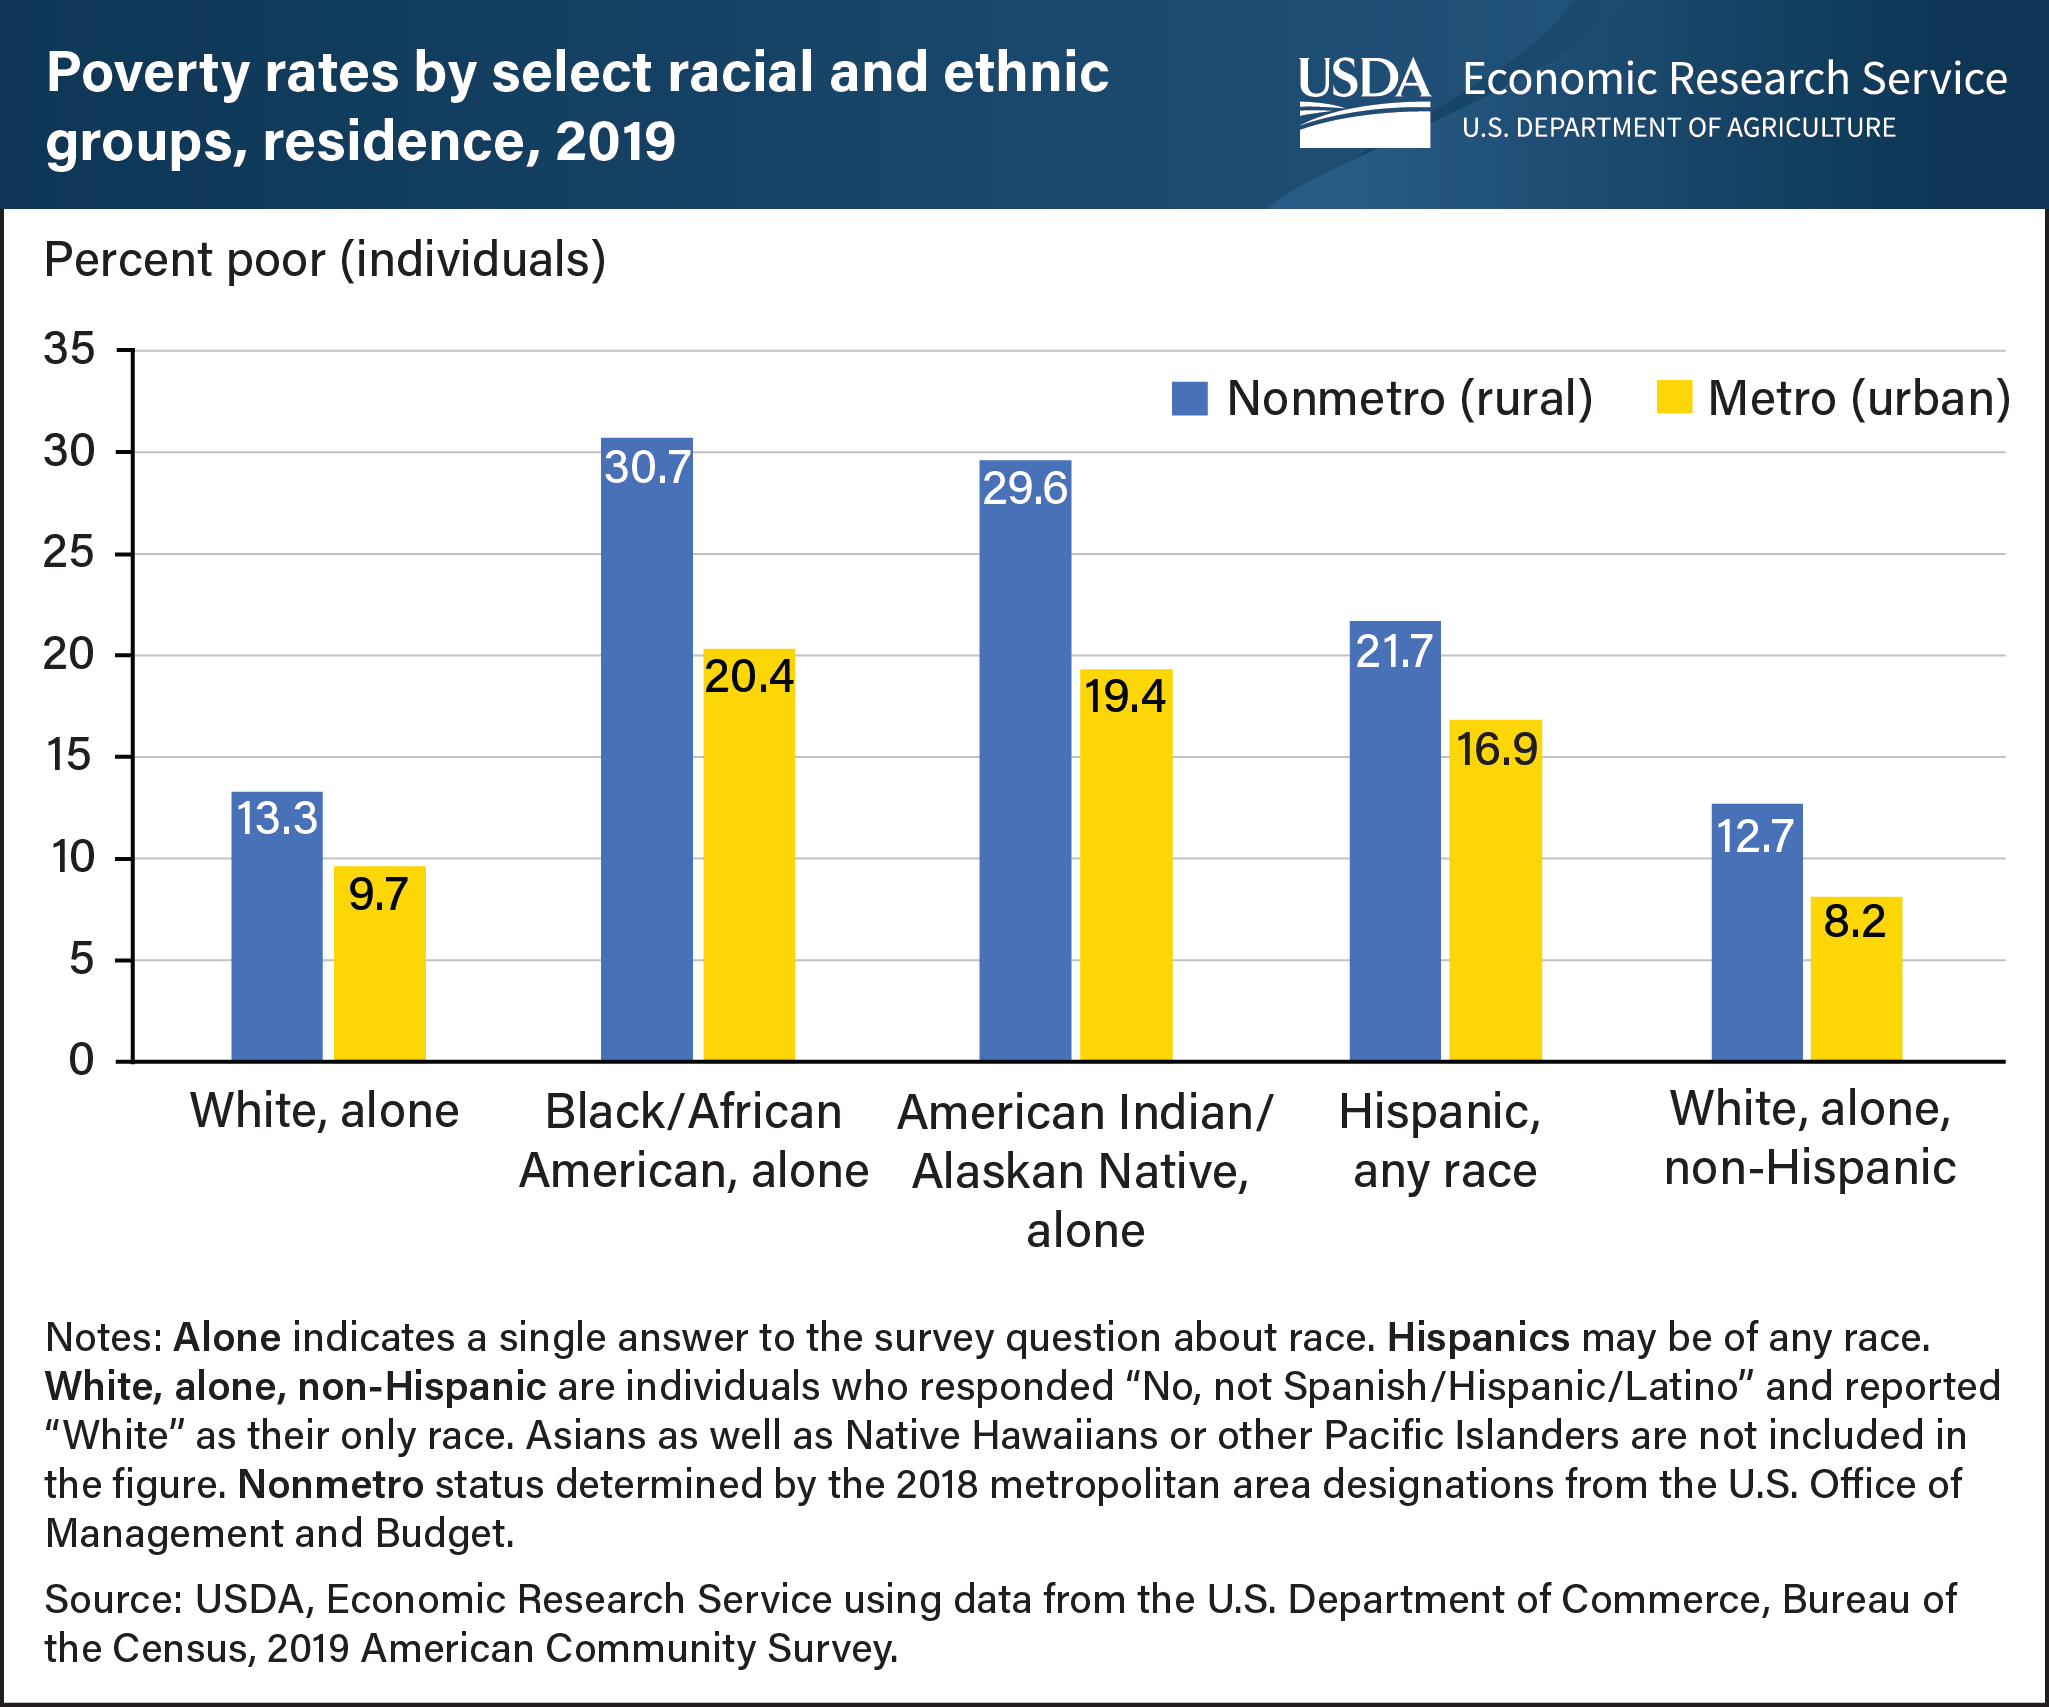
Across all races and ethnicities, U.S. poverty rates in 2019 were higher at 15.4 percent in nonmetro (rural) areas than in metro (urban) areas at 11.9 percent. Rural Black or African American residents had the highest incidence of poverty in 2019 at 30.7 percent, compared with 20.4 percent for that demographic group in urban areas. Rural American Indians or Alaska Natives had the second highest rate at 29.6 percent, compared with 19.4 percent in urban areas. The poverty rate for White residents was about half the rate for either Blacks or American Indians at 13.3 percent in rural areas and 9.7 percent in urban settings. Rural Hispanic residents of any race had the third highest poverty rate at 21.7 percent, compared with 16.9 percent in urban areas. Non-Hispanic White residents had the lowest poverty rates in both rural (12.7 percent) and urban (8.2 percent) areas in 2019. This chart appears in the Economic Research Service topic page for Rural Poverty & Well-Being, updated June 2021.