
Fentanyl and other illicit opioids replaced prescription drugs as drivers of the opioid epidemic in 2011
- by David McGranahan
- 4/2/2021
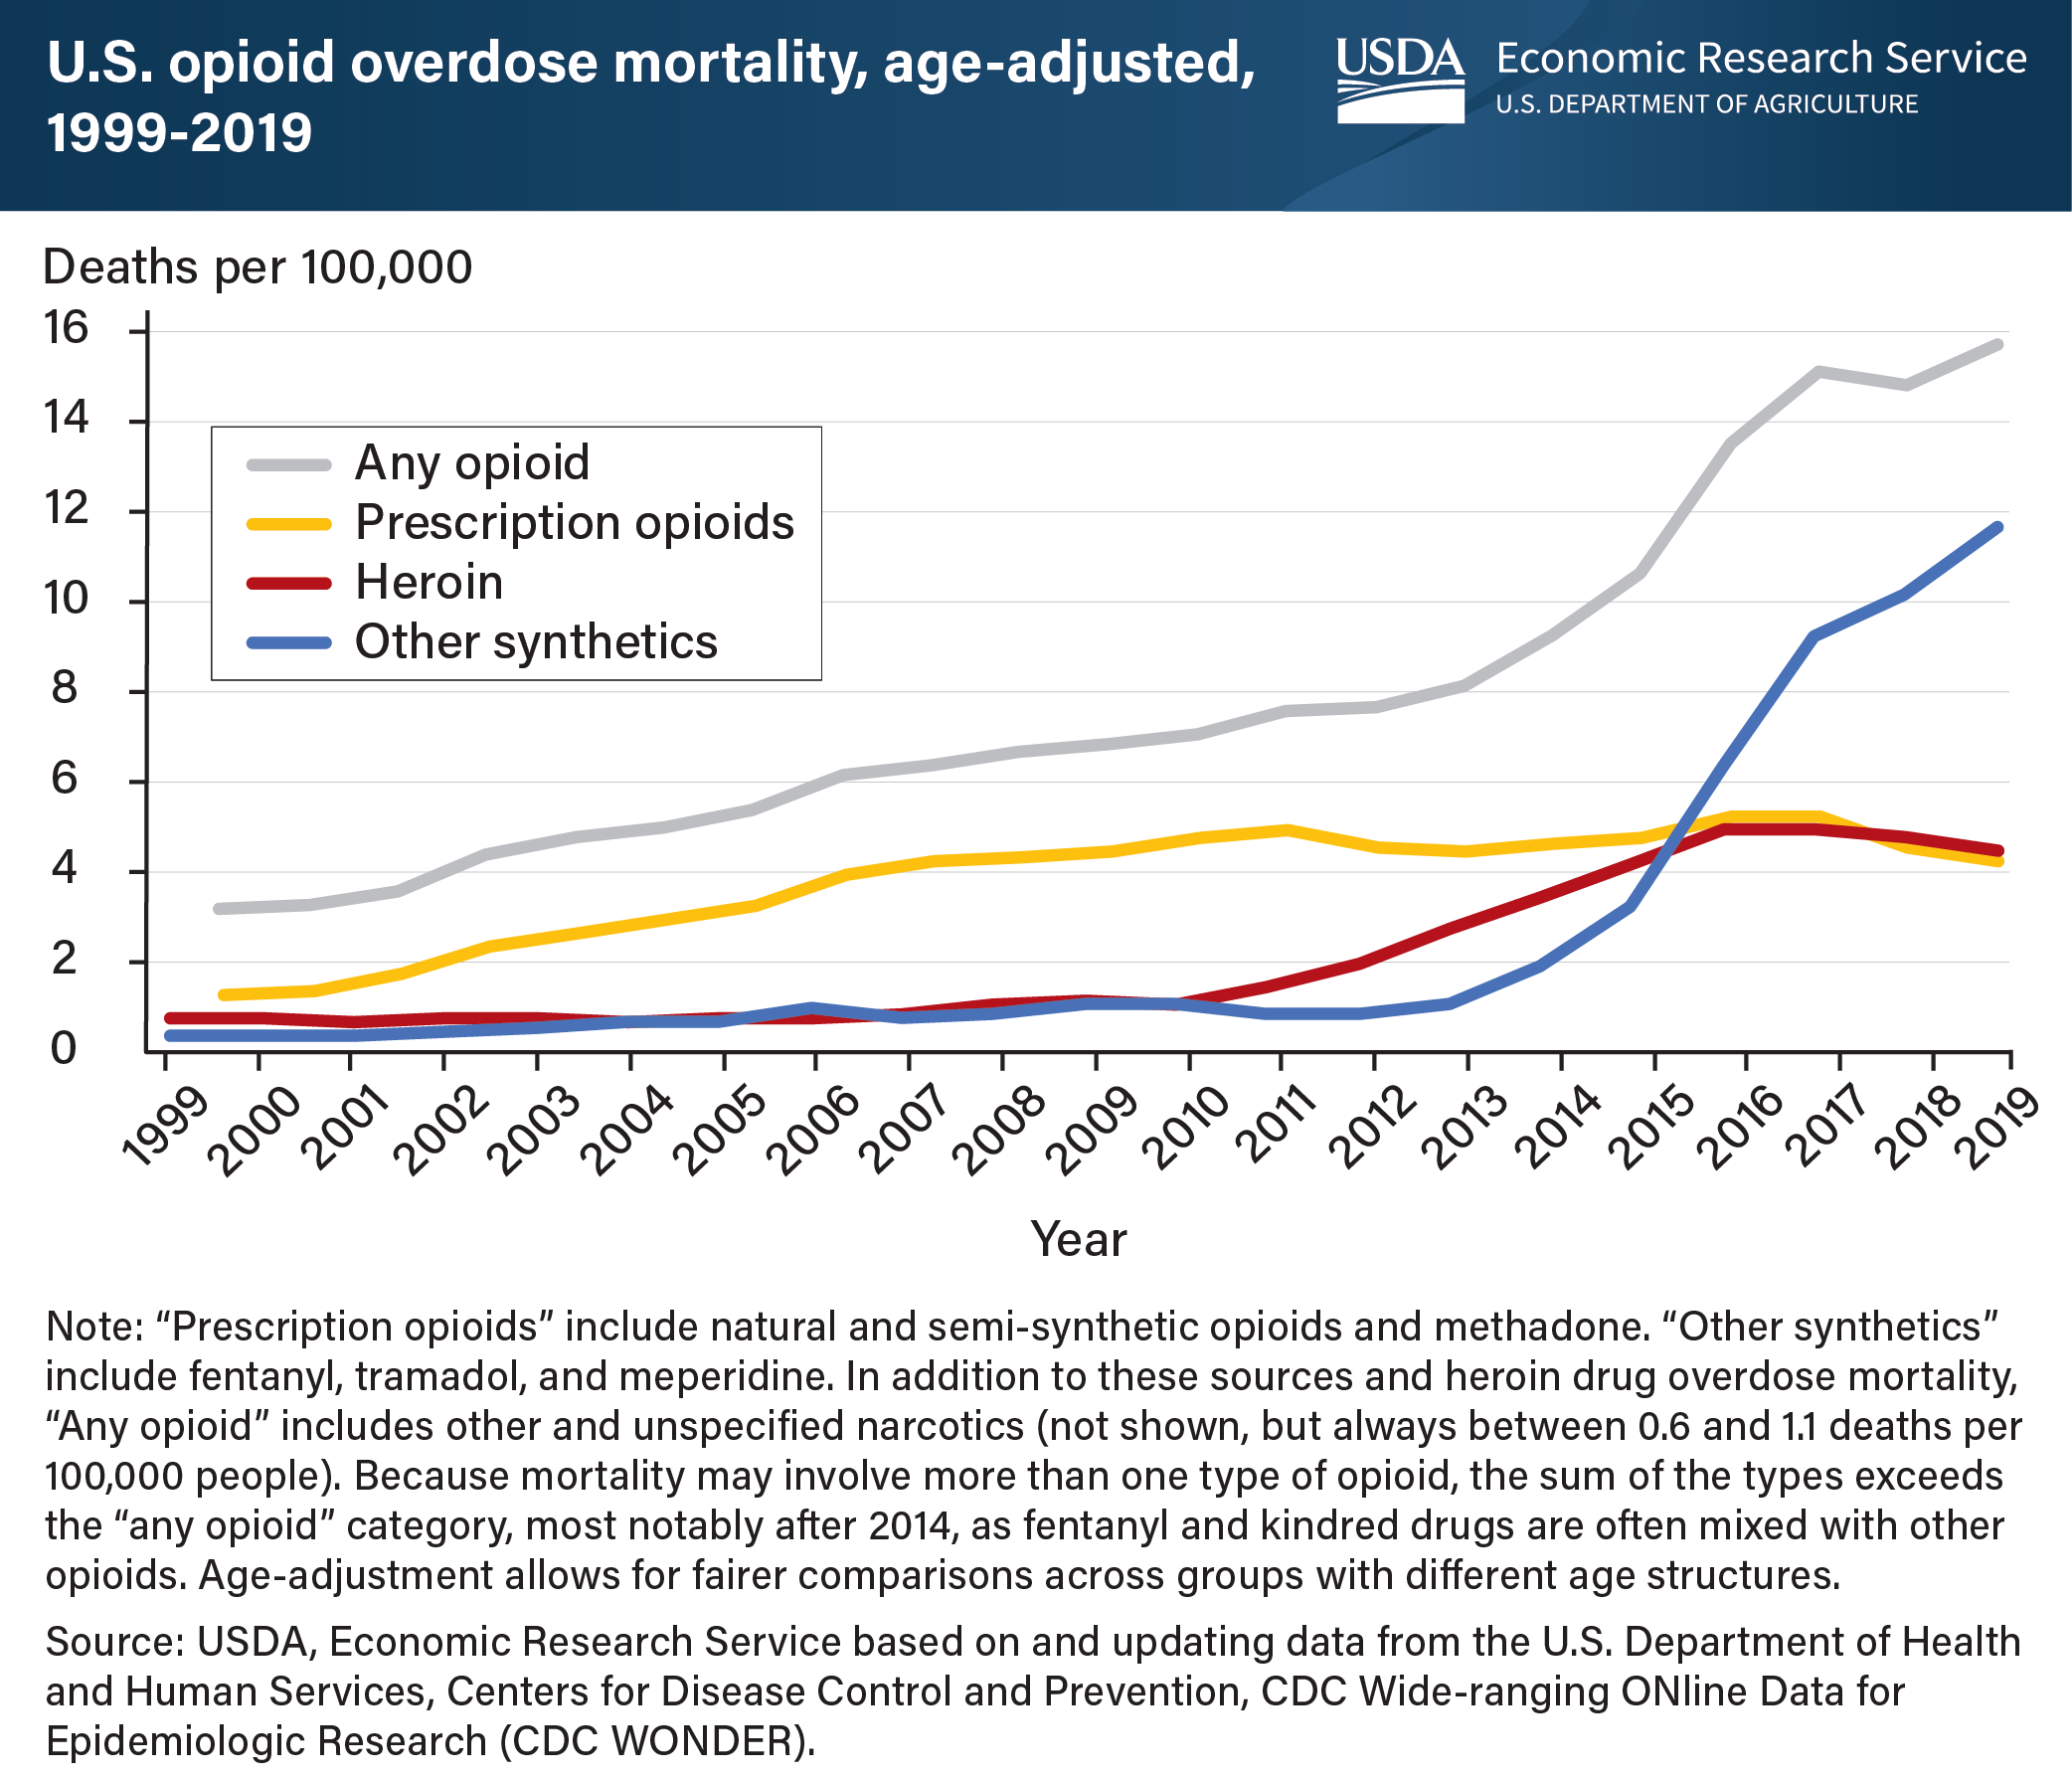
Since the late 1990s, an opioid epidemic has afflicted the U.S. population, particularly those in the prime working ages of 25-54. As a result, the National age-adjusted mortality rate from drug overdoses rose from 6.1 per 100,000 people in 1999 to 21.7 per 100,000 in 2017, then dipped to 20.7 per 100,000 in 2018 and rose back to 21.6 in 2019. Among the prime working age population, the drug overdose mortality rate was 37.8 deaths per 100,000 people in 2019. This rate was exceeded only by cancer (39.2 deaths per 100,000) in 2019 as a major cause of death in this population. ERS researchers, examining the opioid epidemic from 1999 to 2018, observed two distinct phases: a “prescription opioid phase” (1999-2011) and a succeeding “illicit opioid phase” (2011-2018), marked especially by the spread of fentanyl and its analogs. Updated data show the second phase has extended into 2019. Mortality data indicate that in the prescription opioid phase, drug overdose deaths were most prevalent in areas with high rates of physical disability, such as central Appalachia. Rural residents, middle-age men and women in their 40s and early 50s were most affected, as were Whites and American Indian/Alaskan Natives. Opioid prescriptions ceased driving the epidemic in 2011 as increased regulation and greater awareness of prescription addiction problems took hold. The illicit opioid phase that followed involved primarily heroin and synthetic opioids, such as fentanyl. Fentanyl and its analogs are often used to spike other addictive drugs, including prescription opioids, creating powerful combinations that make existing drug addictions more lethal. During the study period, this second phase was concentrated in the northeastern United States, particularly in areas of employment loss. This phase most often involved urban young adult males, ages 25 to 39. All the racial/ethnic groups studied—Hispanics, Blacks, American Indian/Alaskan Natives, and Whites—were affected. This chart updates data found in the Economic Research Service report The Opioid Epidemic: A Geography in Two Phases, released April 2021.
We’d welcome your feedback!
Would you be willing to answer a few quick questions about your experience?